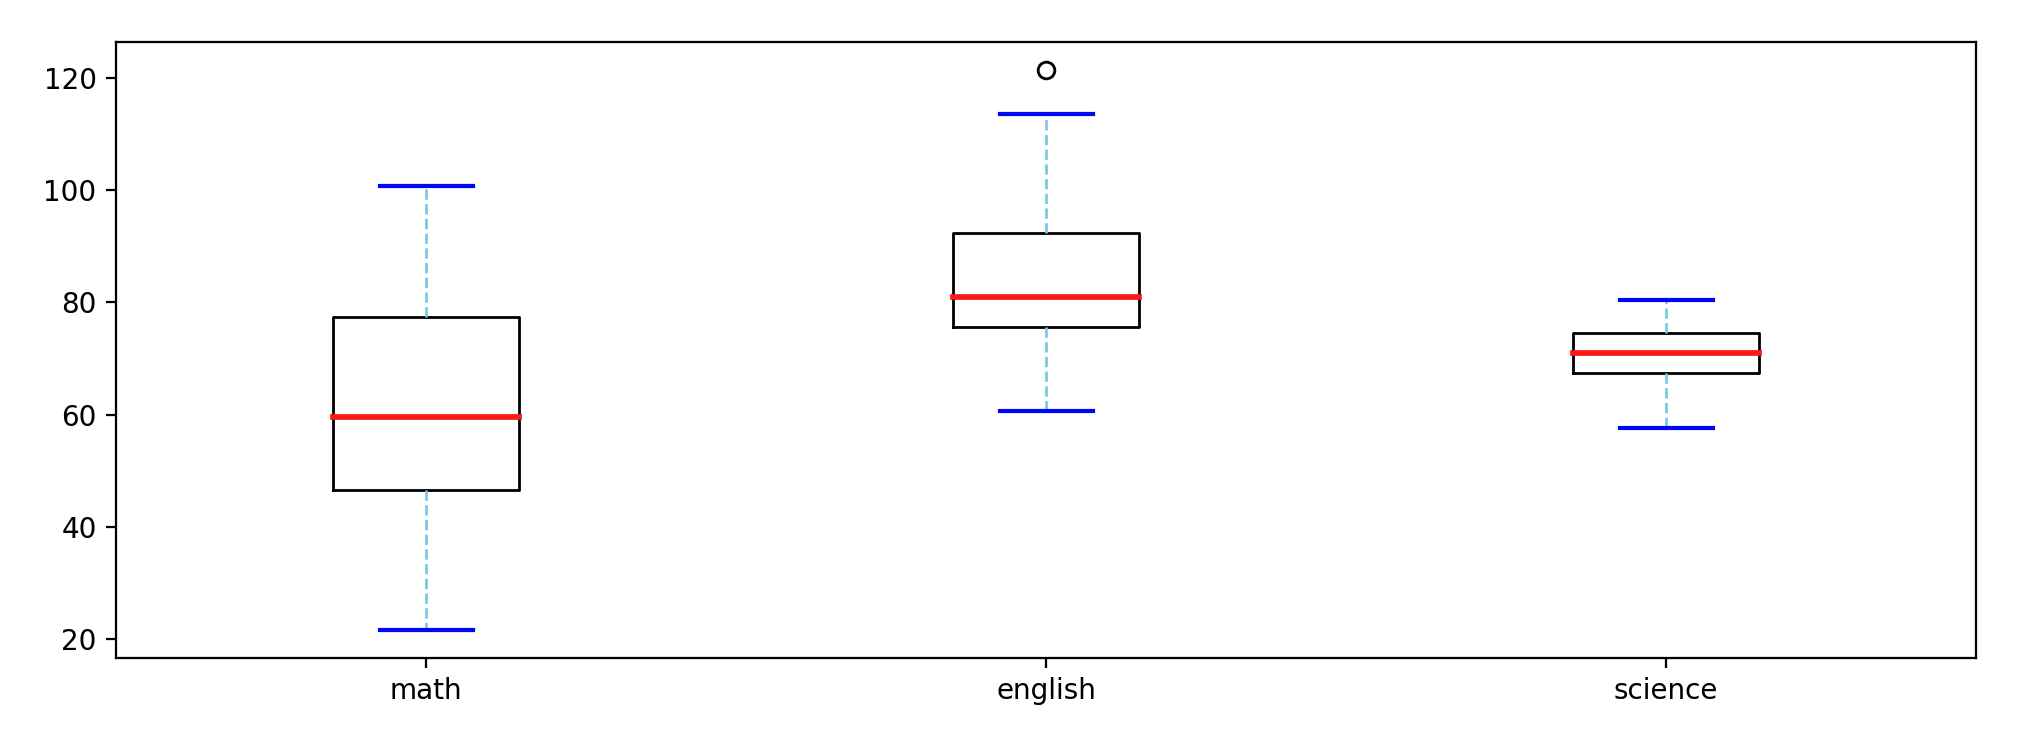
Jay's Cookbook
Menu
  • Tags
  • Categories
  • Projects
Computer Science
OS
Network
Data Structure
Algorithm
Language
Code Architecture
Python
Javascript
Typescript
Java
Backend
Backend Theory
TypeORM
Node.js
NestJS
FastAPI
Frontend
HTML/CSS
React
Next.js
Data Engineering
DE Theory
MySQL
MongoDB
Elastic
Redis
Kafka
Spark
Airflow
AI
Basic
Pytorch
NLP
Computer Vision
Data Analytics
Statistics
Pandas
Matplotlib
DevOps
Git
Docker
Kubernetes
AWS
Matplotlib Series [Part11] Box and Whisker Plot
data_analytics
matplotlib

Matplotlib Series [Part11] Box and Whisker Plot

Jay Kim
Jay Kim 21 Jan 2022
Matplotlib Series [Part10] Scatter Plot 끝

Table of Contents


n_data = 40

math_score = np.random.normal(60, 20, (n_data, 1))
eng_score = np.random.normal(85, 12, (n_data, 1))
sci_score = np.random.normal(70, 5, (n_data, 1))

data = np.hstack((math_score, eng_score, sci_score))

fig, ax = plt.subplots(figsize=(12, 4))
medianprops = {'linewidth':2, 'color':'red'}
whiskerprops = {'linewidth':1, 'color':'skyblue', 'linestyle':'--'}
capprops = {'linewidth':1.5, 'color':'blue'}
ax.boxplot(data, labels=['math', 'english', 'science'], medianprops=medianprops, whiskerprops=whiskerprops, capprops=capprops);

Matplotlib Series [Part10] Scatter Plot 끝

You may also like

See all matplotlib
21 Jan 2022 Matplotlib Series [Part10] Scatter Plot
data_analytics
matplotlib

Matplotlib Series [Part10] Scatter Plot

20 Jan 2022 Matplotlib Series [Part9] Pie Plot
data_analytics
matplotlib

Matplotlib Series [Part9] Pie Plot

20 Jan 2022 Matplotlib Series [Part8] Histogram Plot
data_analytics
matplotlib

Matplotlib Series [Part8] Histogram Plot

Jay Kim

Jay Kim

Web development, data engineering for human for the Earth. I share posts, free resources and inspiration.

Rest
Lifestyle
Hobby
Hobby
Hobby
Hobby
2025 © Jay's Cookbook. Crafted & Designed by Artem Sheludko.