Table of Contents
import numpy as np
import matplotlib.pyplot as plt

n_data = 1000
data = np.random.normal(0, 1, (n_data,))
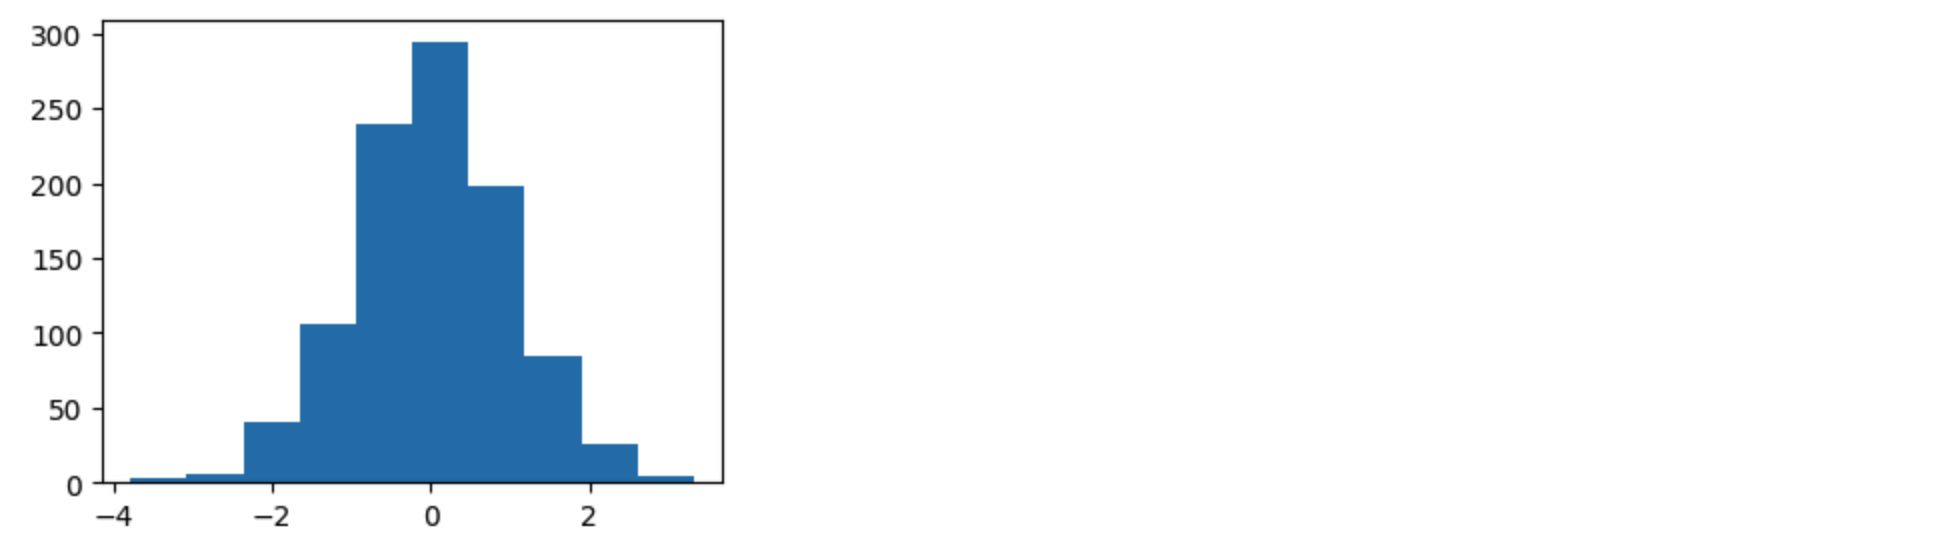
히스토그램 기본
fig, ax = plt.subplots(figsize=(4, 3))

ax.hist(data)
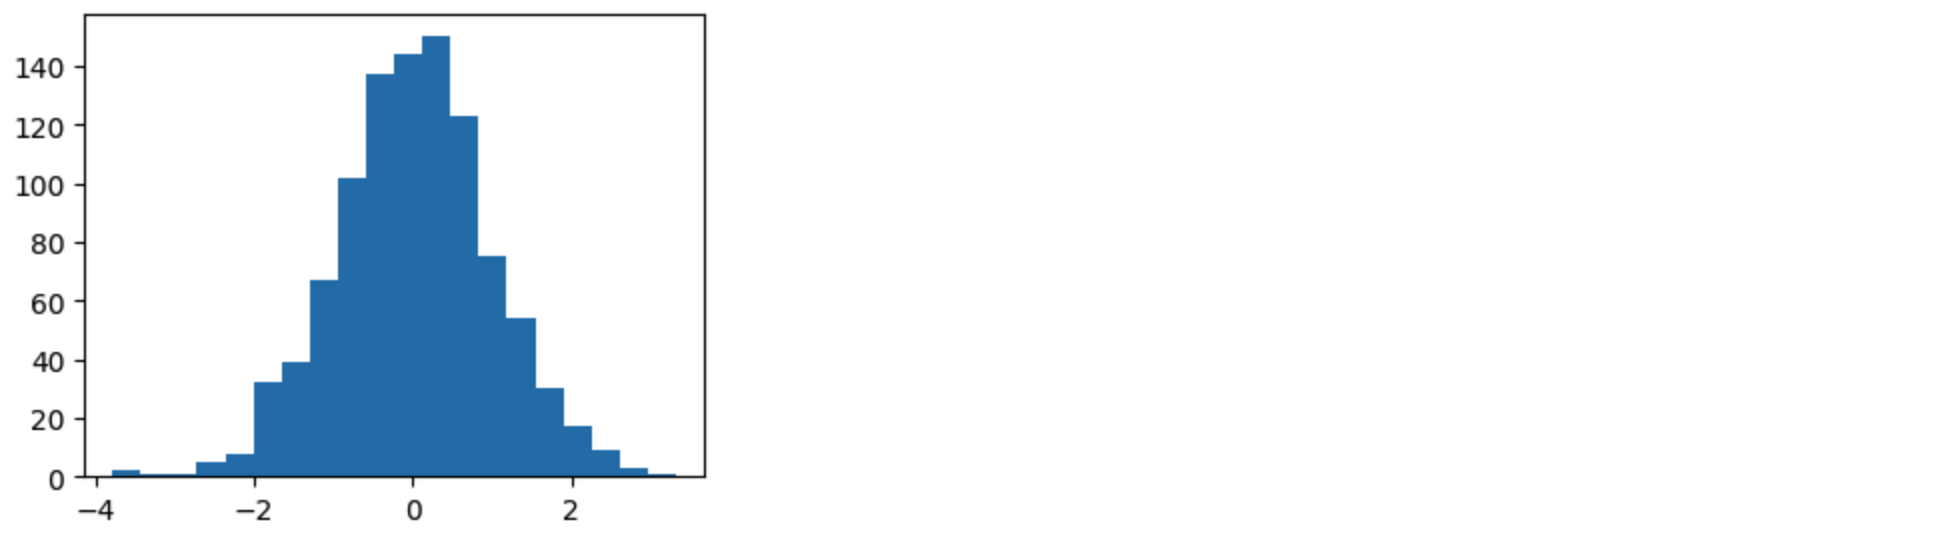
ax.hist(data, bins=20)
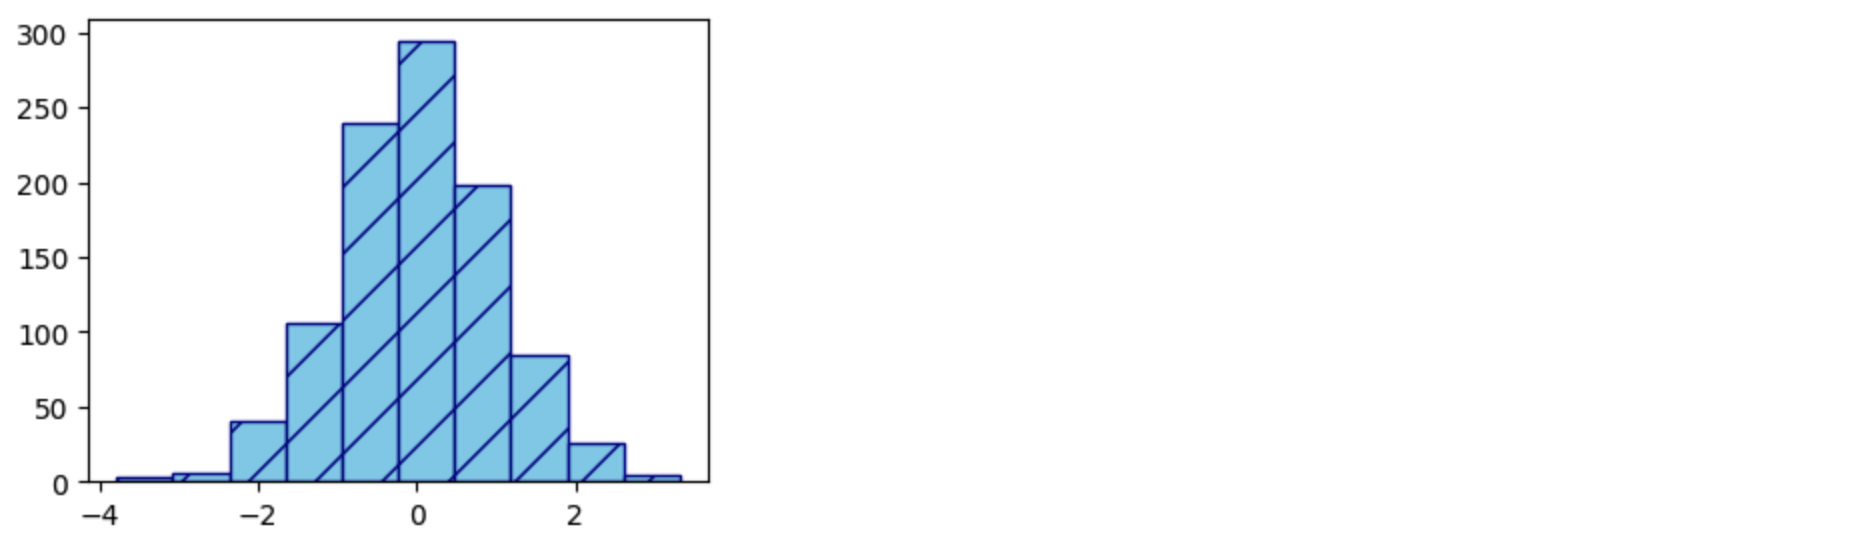
히스토그램 꾸미기
ax.hist(data, facecolor='skyblue', edgecolor='darkblue', hatch='/')
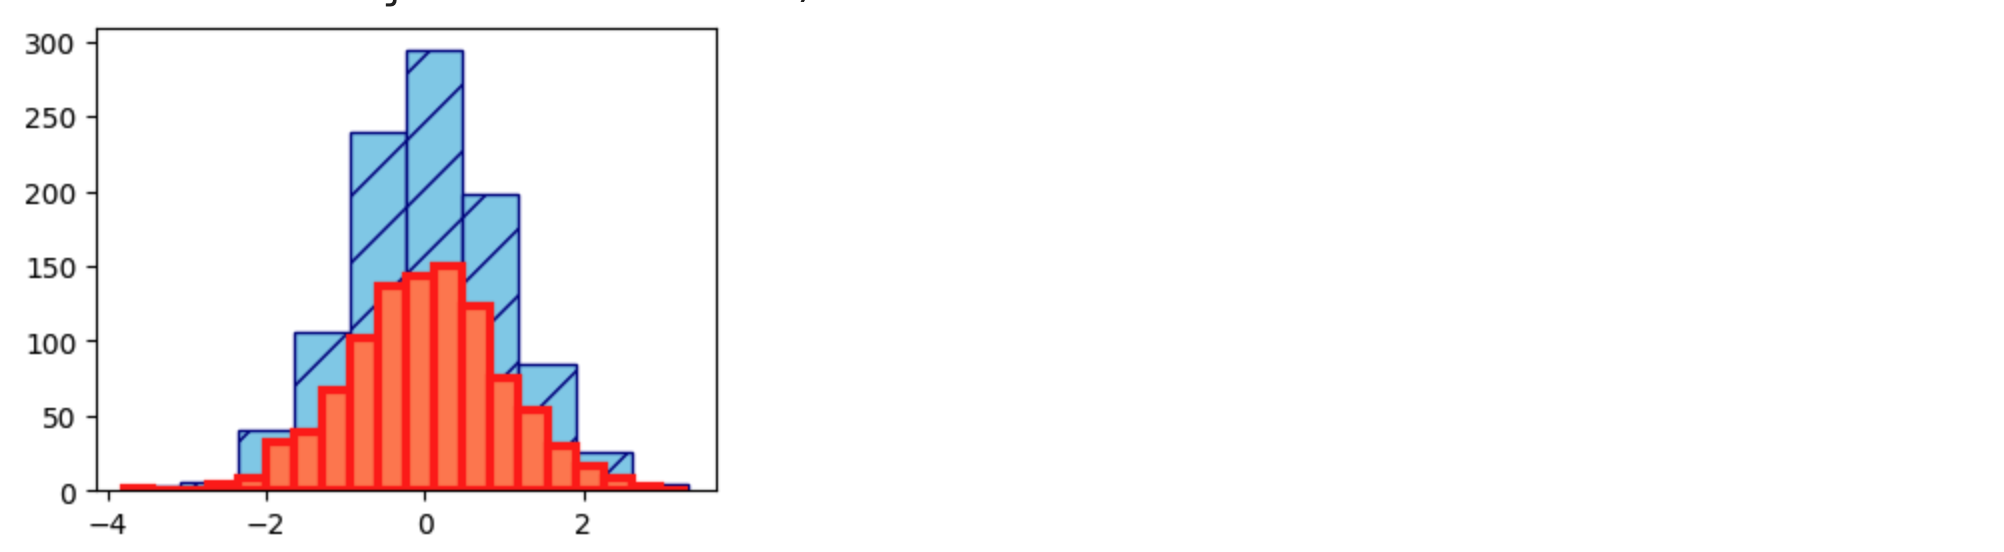
여러 개의 히스토그램
fig, ax = plt.subplots(figsize=(4, 3))

ax.hist(data, facecolor='skyblue', edgecolor='darkblue', hatch='/')
ax.hist(data, bins=20, facecolor='coral', edgecolor='red', linewidth=3)
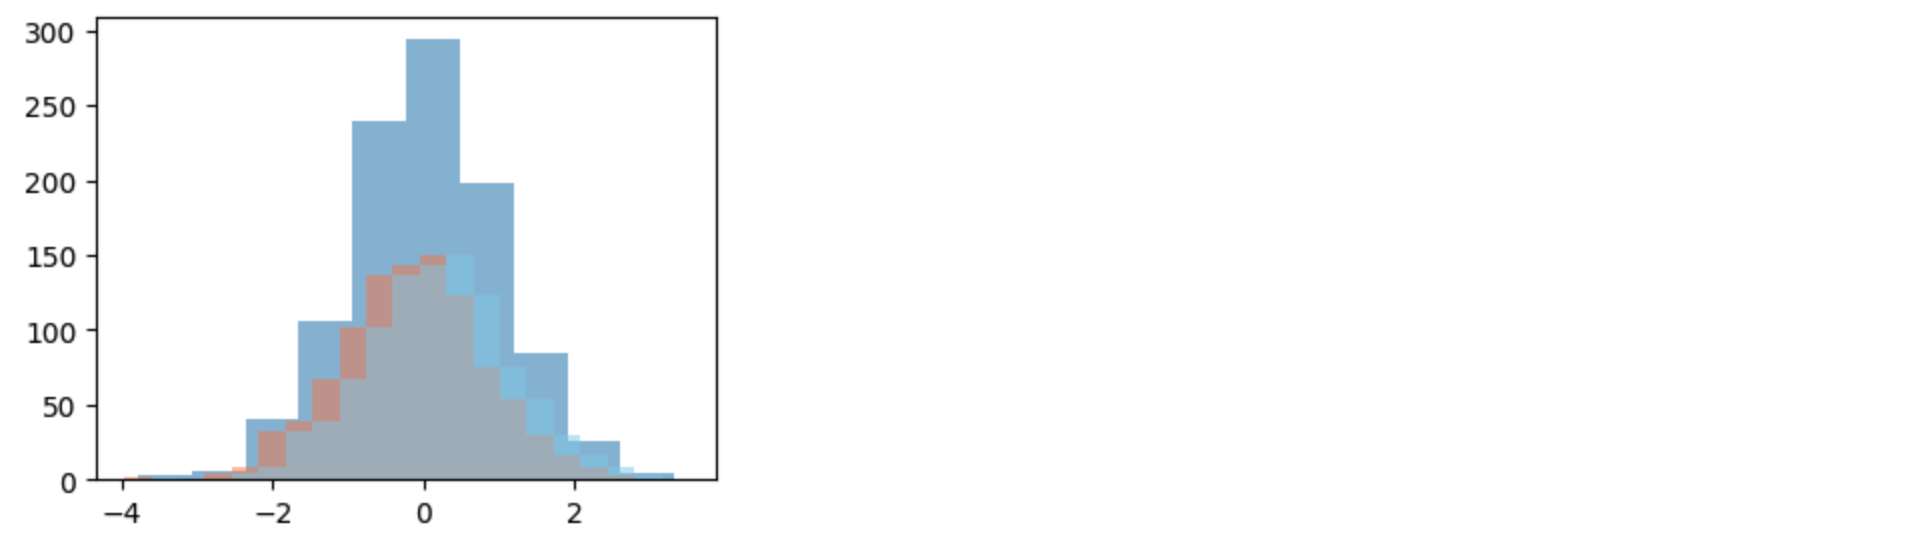
fig, ax = plt.subplots(figsize=(4, 3))

ax.hist(data, bins=10, align='mid', alpha=0.5)
ax.hist(data, bins=20, facecolor='coral', align='left', alpha=0.5)
ax.hist(data, bins=20, facecolor='skyblue', align='right', alpha=0.5)
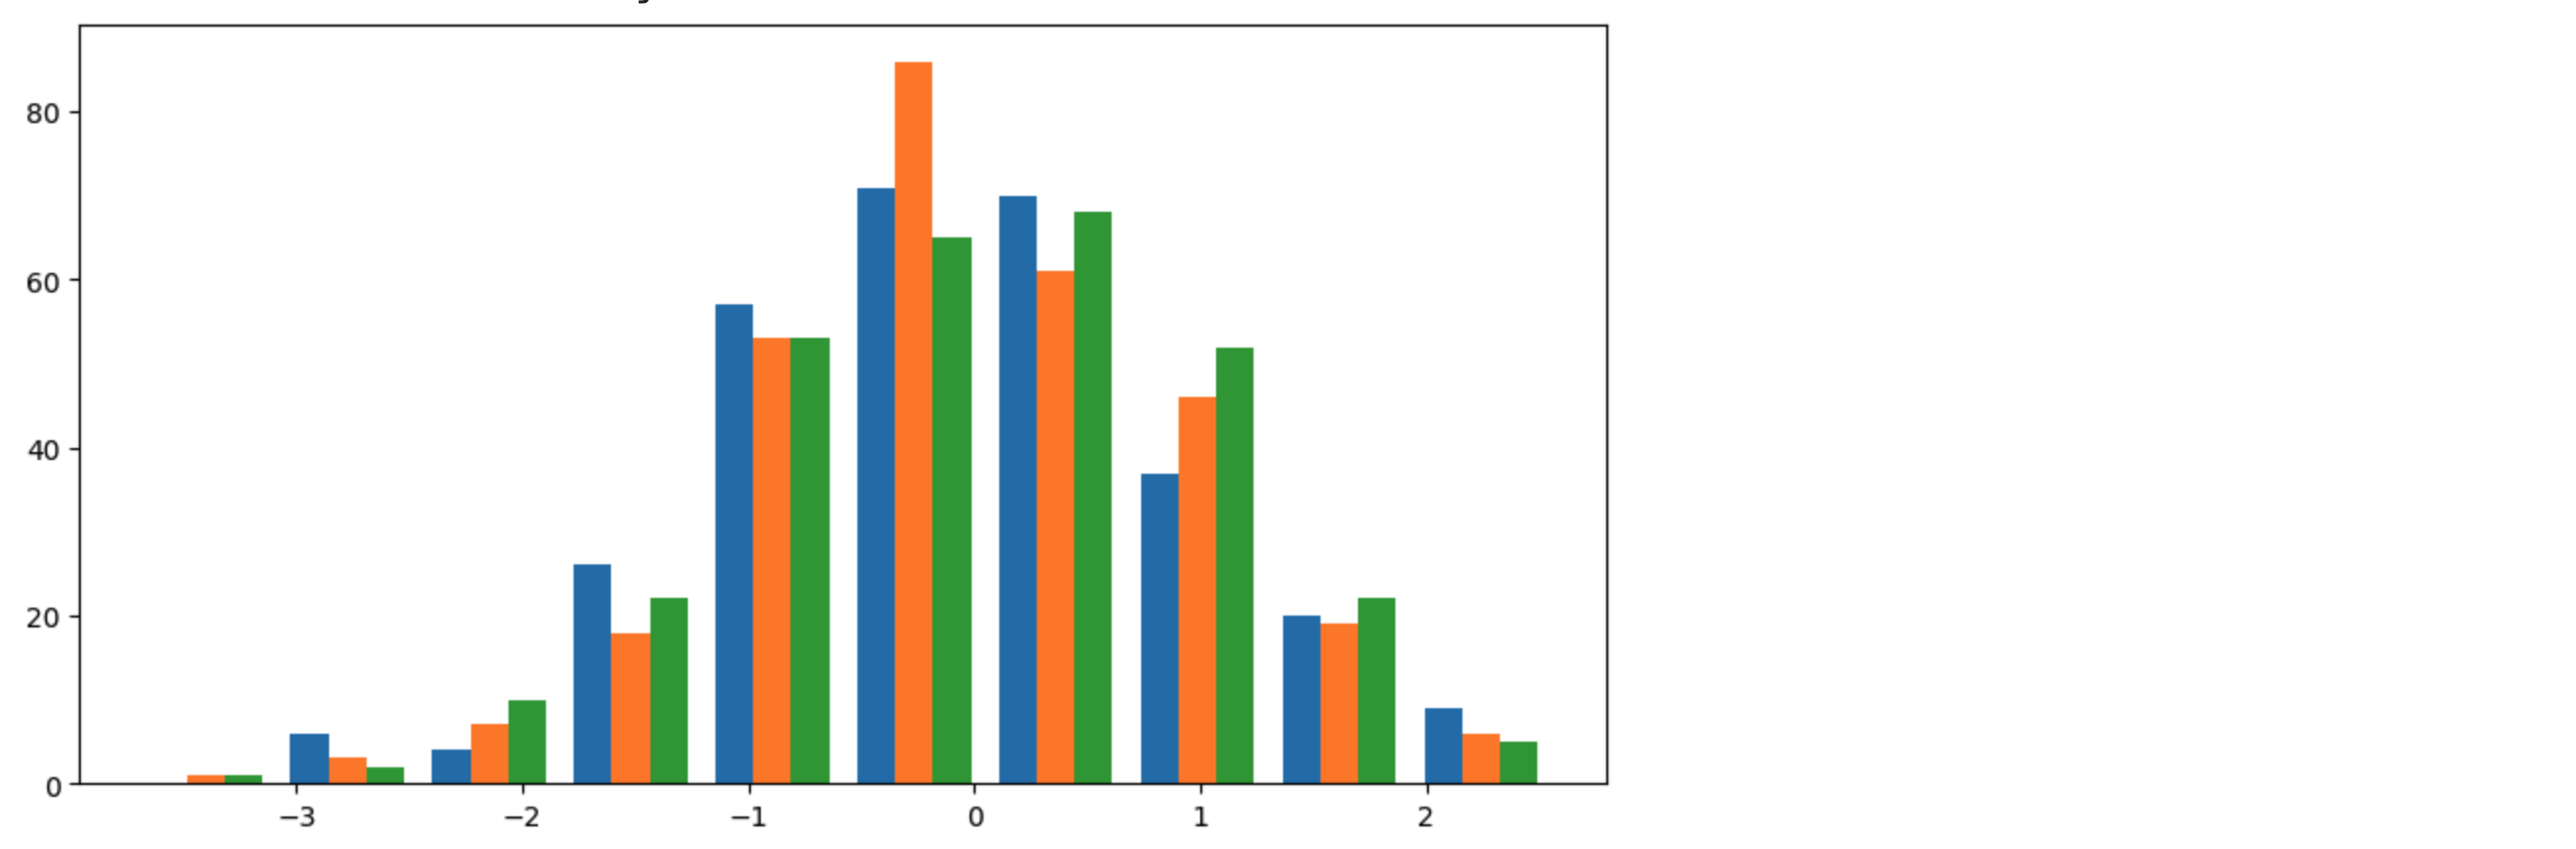
n_class = 3
n_data = 300

data = np.random.normal(0, 1, (n_data, n_class))

fig, ax = plt.subplots(figsize=(14, 10))
ax.hist(data)
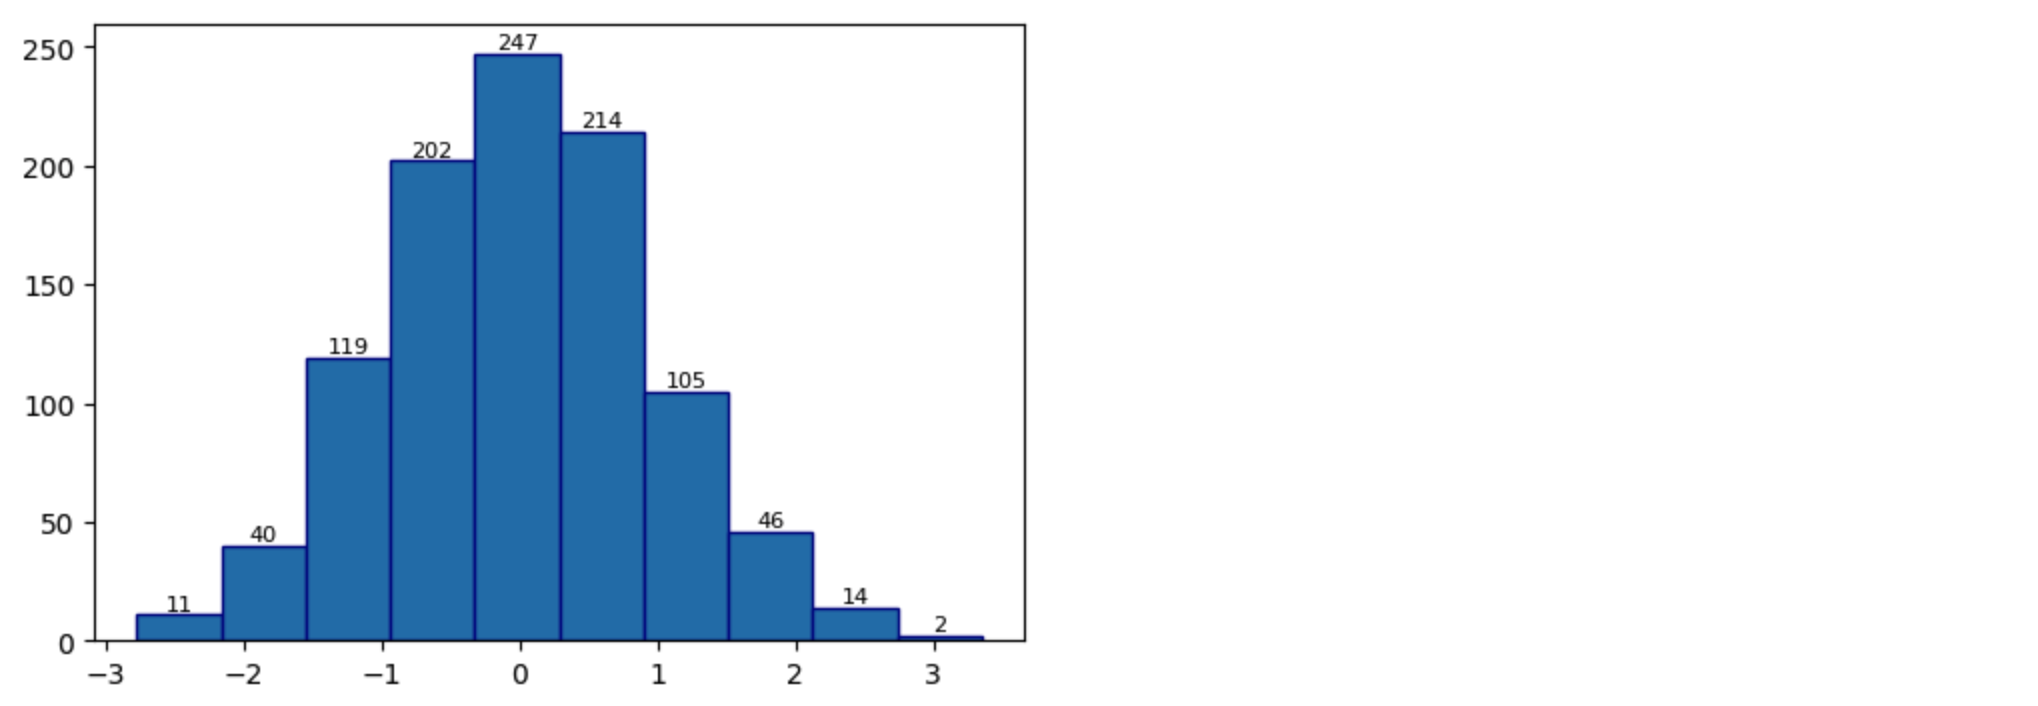
텍스트 넣기
n_data = 1000
data = np.random.normal(0, 1, (n_data,))

fig, ax = plt.subplots(figsize=(6, 4))

freqs, bin_edges, rects = ax.hist(data, edgecolor='darkblue')

for idx, rect in enumerate(rects):
    width = rect.get_width()
    x_pos = rect.get_x()
    y_pos = rect.get_height()
    ax.text(x_pos + width/2, y_pos + 2, int(freqs[idx]), ha='center', fontsize=8)