Table of Contents
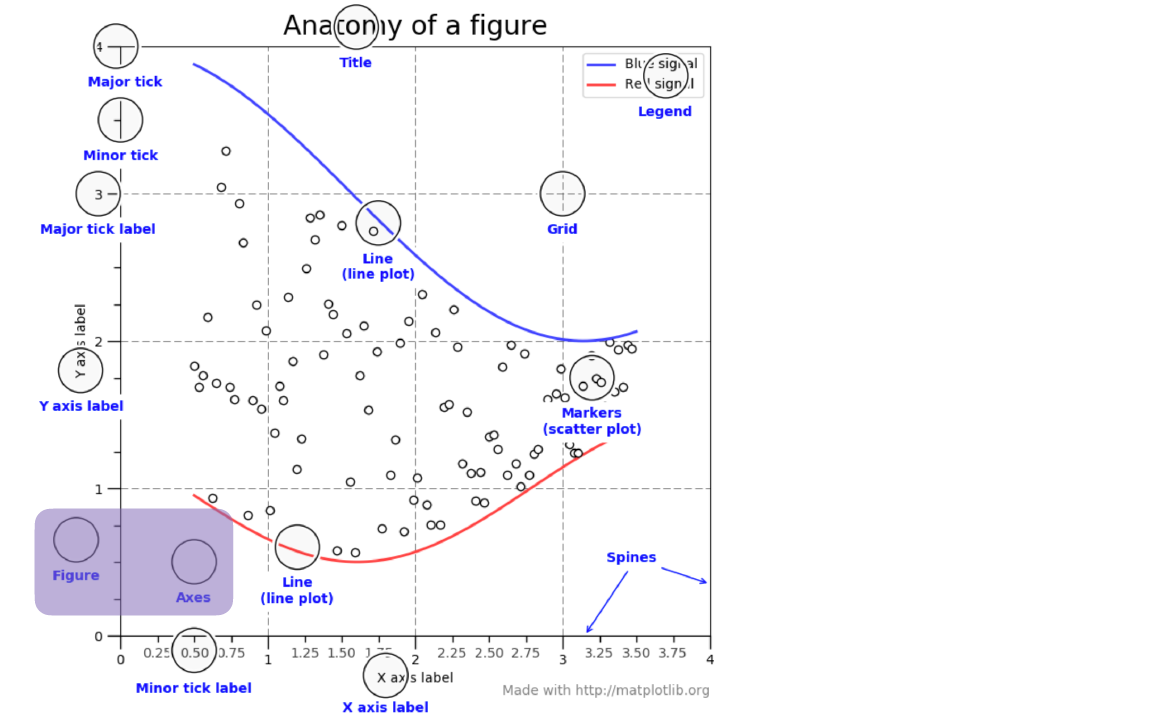
Matplotlib 구성요소
Figures and Axes 만들기
- 하나의 도화지를 Figure, 그 안에 그린 그래프 한 개를 ax, 그래프 ax의 모음을 axes
첫 번째 방법
ax = fig.add_subplot()
import matplotlib.pyplot as plt

# jupyter lab 사용시 추가해줄 명령어
!pip install ipympl
%matplotlib widget

fig = plt.figure()
fig = plt.figure(figsize=(5, 3), facecolor='aliceblue')
ax = fig.add_subplot()
ax1 = fig.add_subplot(221)
ax4 = fig.add_subplot(224)
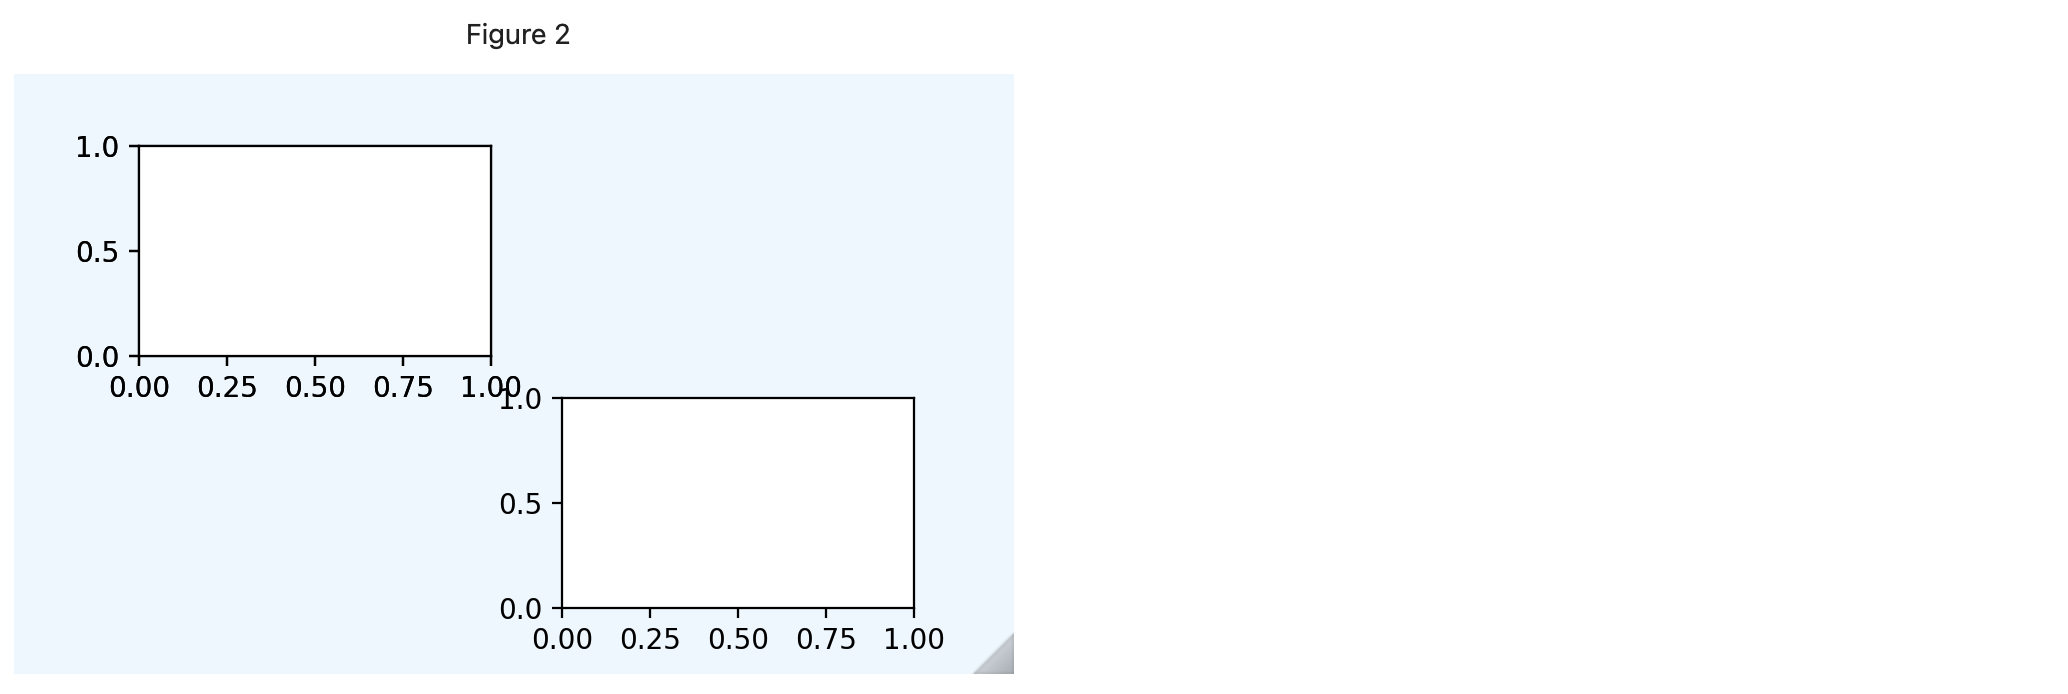
ax1 = fig.add_subplot(221) # 2행 2열중 첫 번째
ax2 = fig.add_subplot(222) # 2행 2열중 두 번째
ax3 = fig.add_subplot(212) # 2행 1열중 두 번째
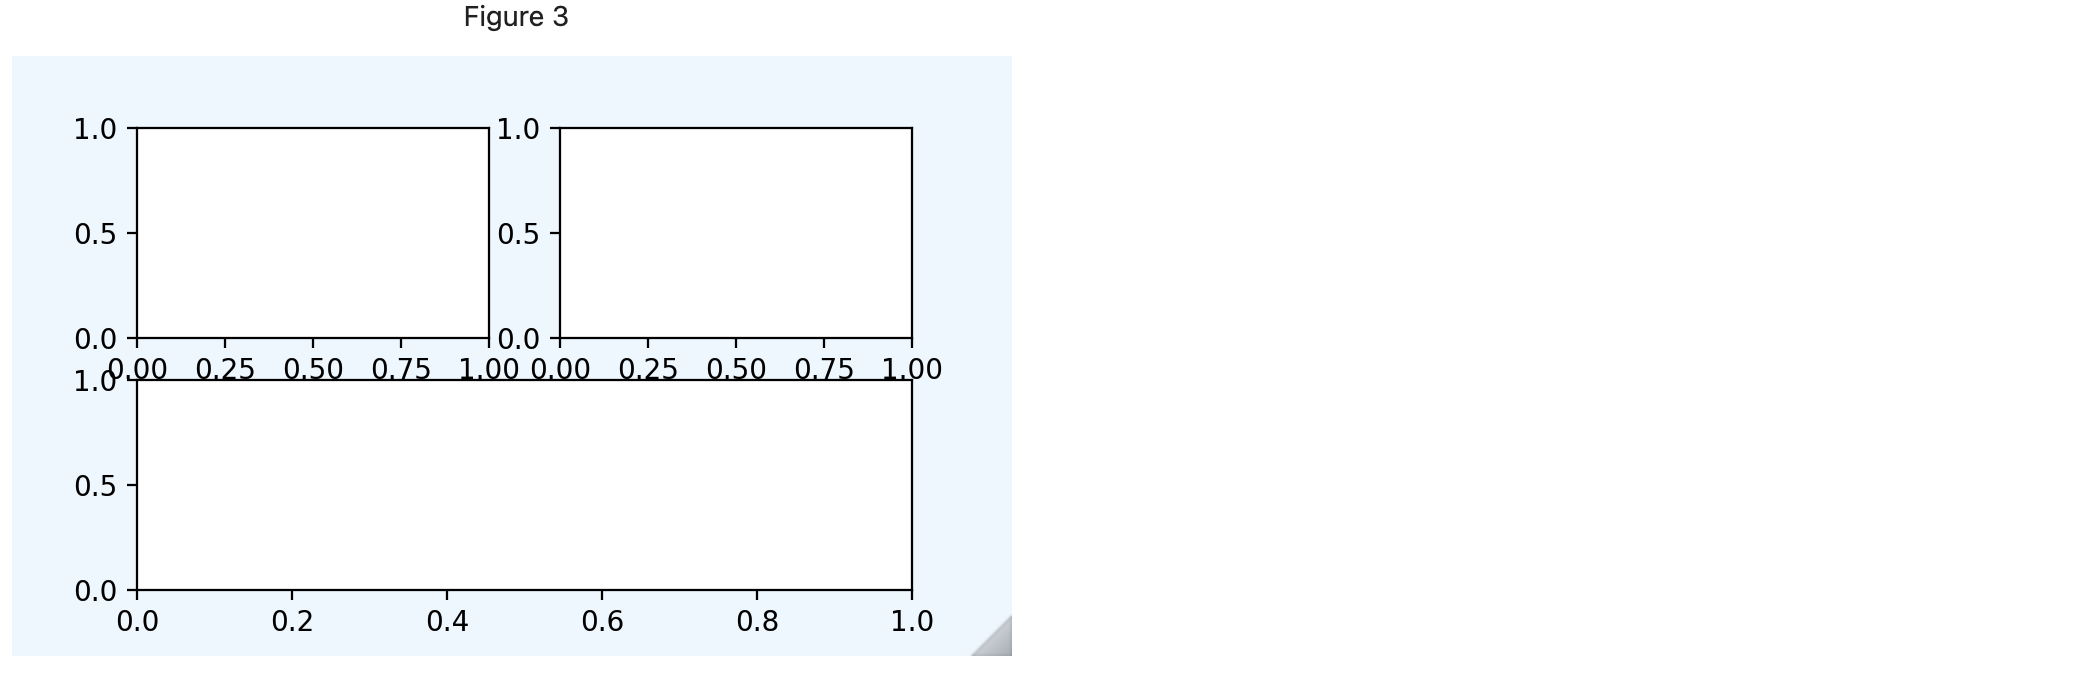
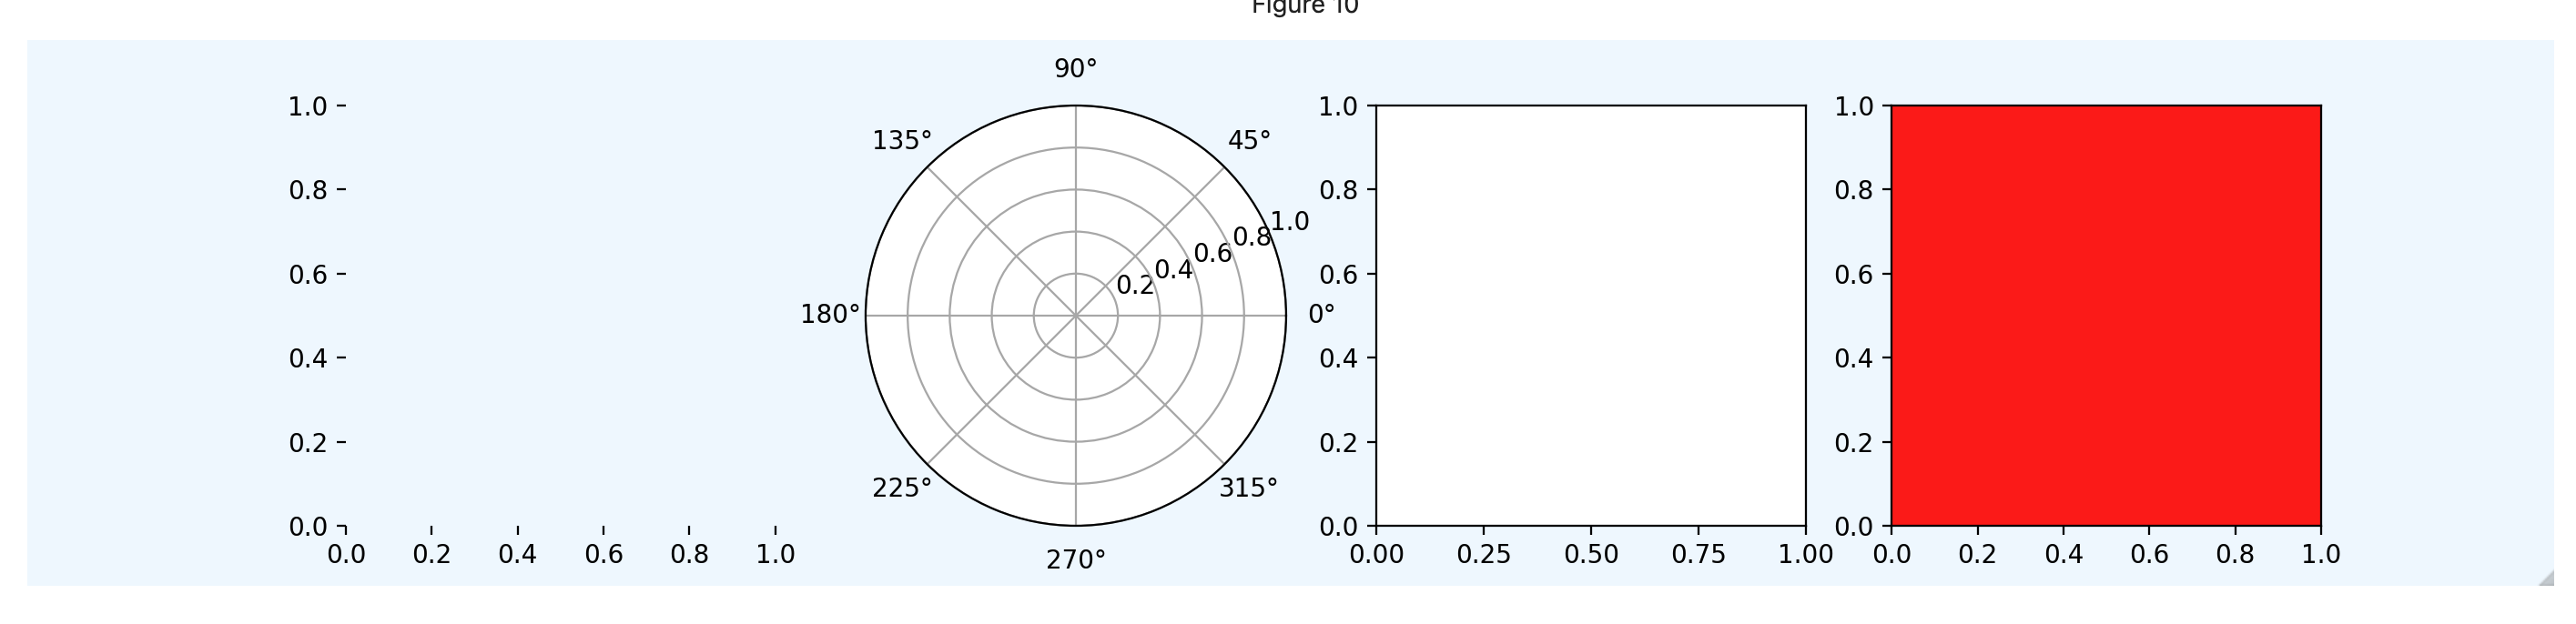
fig.add_subplot(141, frameon=False)  # subplot with no frame
fig.add_subplot(142, projection='polar')  # polar subplot
fig.add_subplot(143, sharex=ax1)  # subplot sharing x-axis with ax1
fig.add_subplot(144, facecolor="red")  # red subplot
두 번째 방법
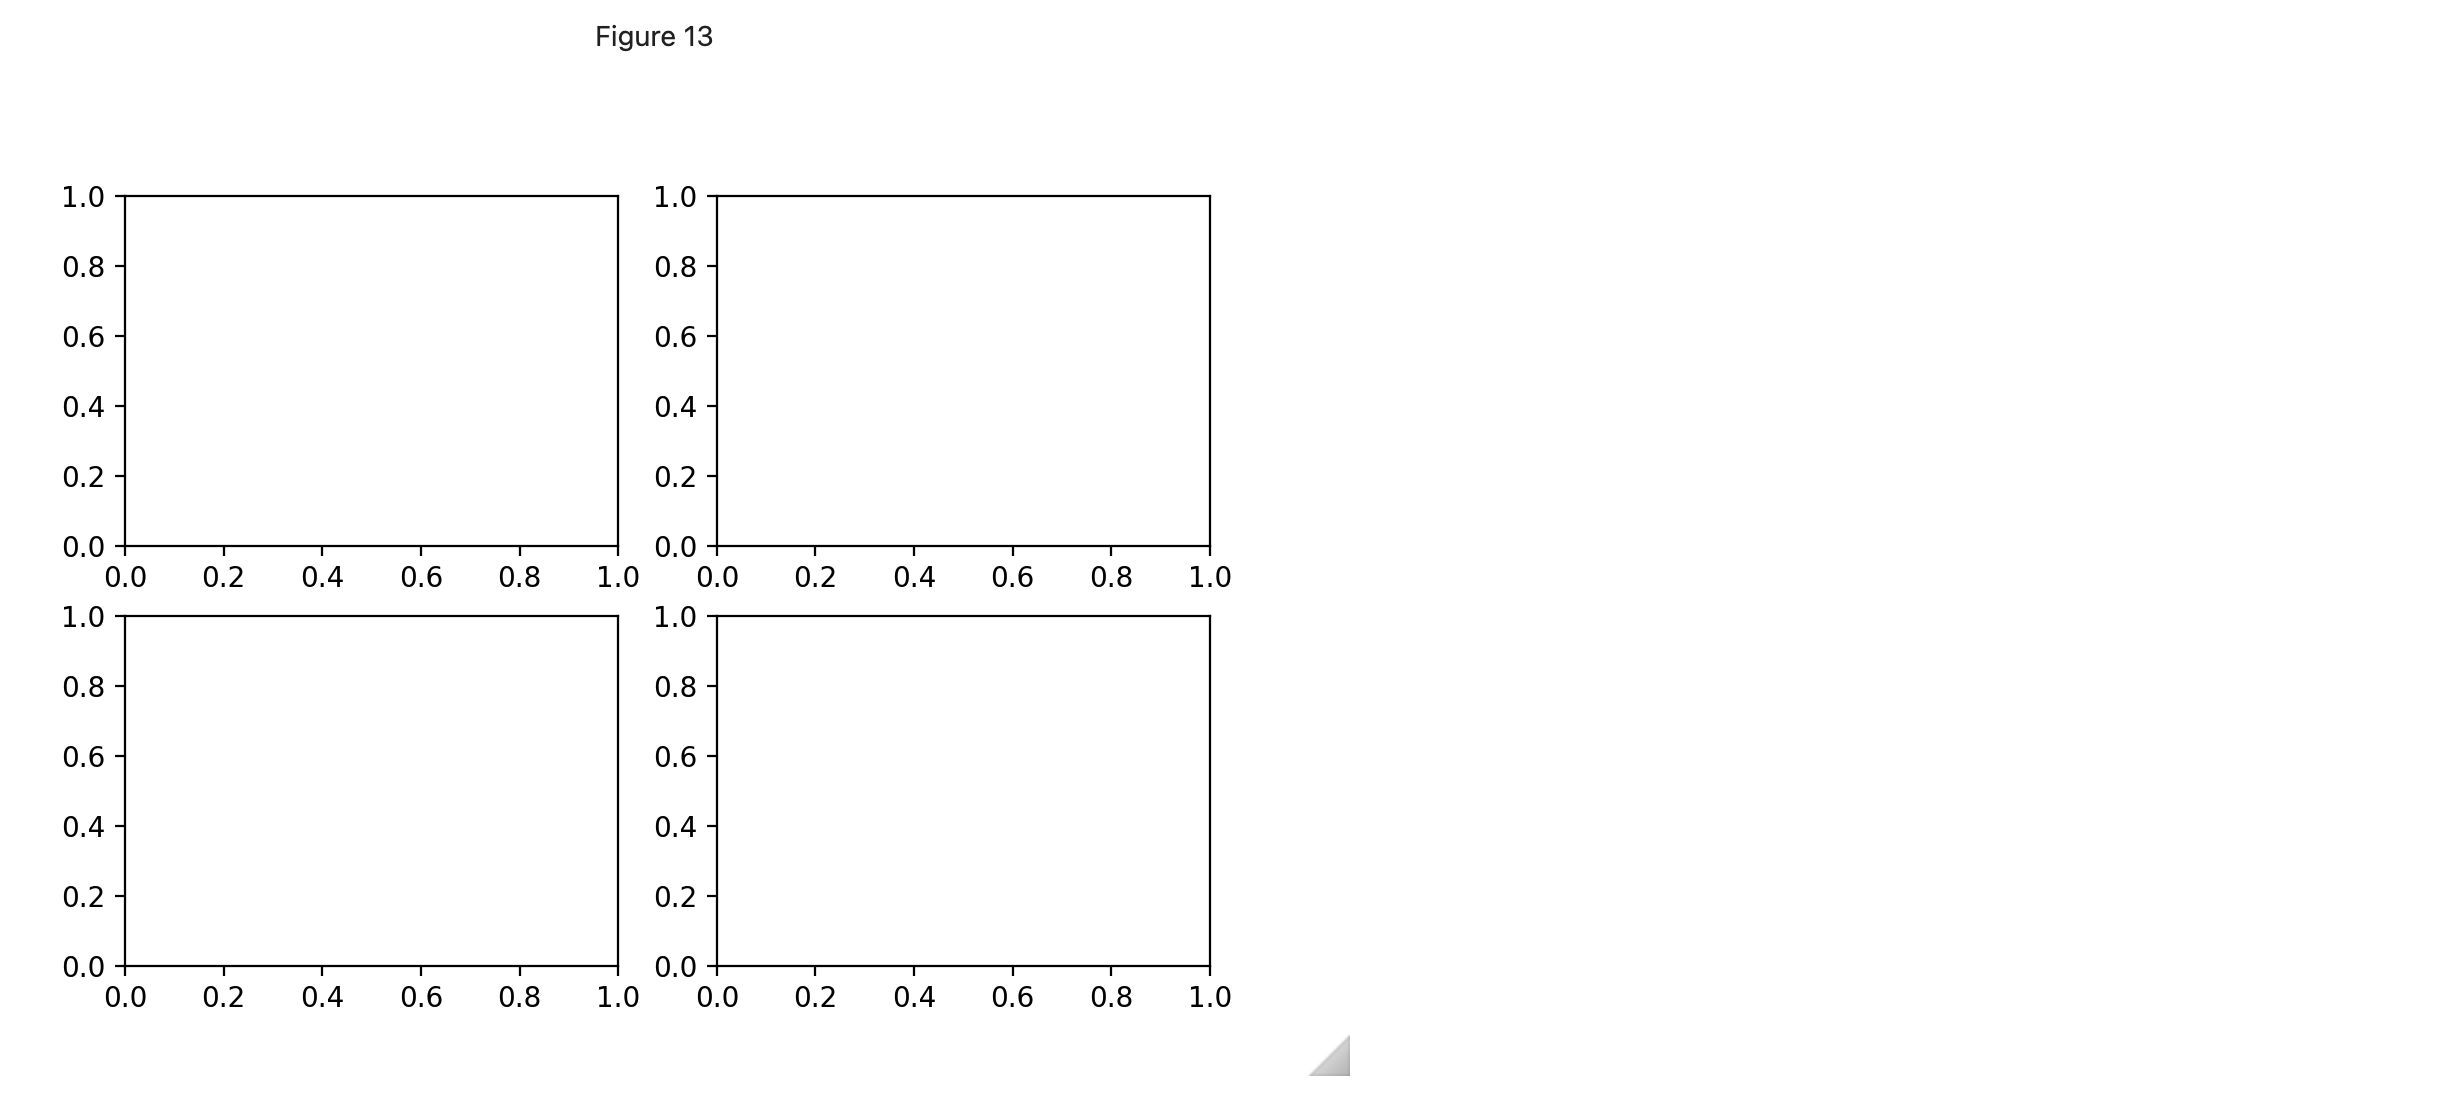
fig, axes = plt.subplots()- 하나하나
add_subplot()해 줄 필요없어진다 - 하지만 이 방법으로는 일정하지 않은 간격을 갖는 axes를 만들 수는 없다
fig, axes = plt.subplots(figsize=(7, 5), nrows=2, ncols=2)
axes
----------------------------------------------------------
array([[<AxesSubplot: >, <AxesSubplot: >],
       [<AxesSubplot: >, <AxesSubplot: >]], dtype=object)

ax1 = axes[0][0]
ax2 = axes[0][1]
ax3 = axes[1][0]
ax4 = axes[1][1]


axes = axes.flatten()
----------------------------------------------------------
array([<AxesSubplot: >, <AxesSubplot: >, <AxesSubplot: >, <AxesSubplot: >], dtype=object)


ax1 = axes[0]
ax2 = axes[1]
ax3 = axes[2]
ax4 = axes[3]
세 번째 방법
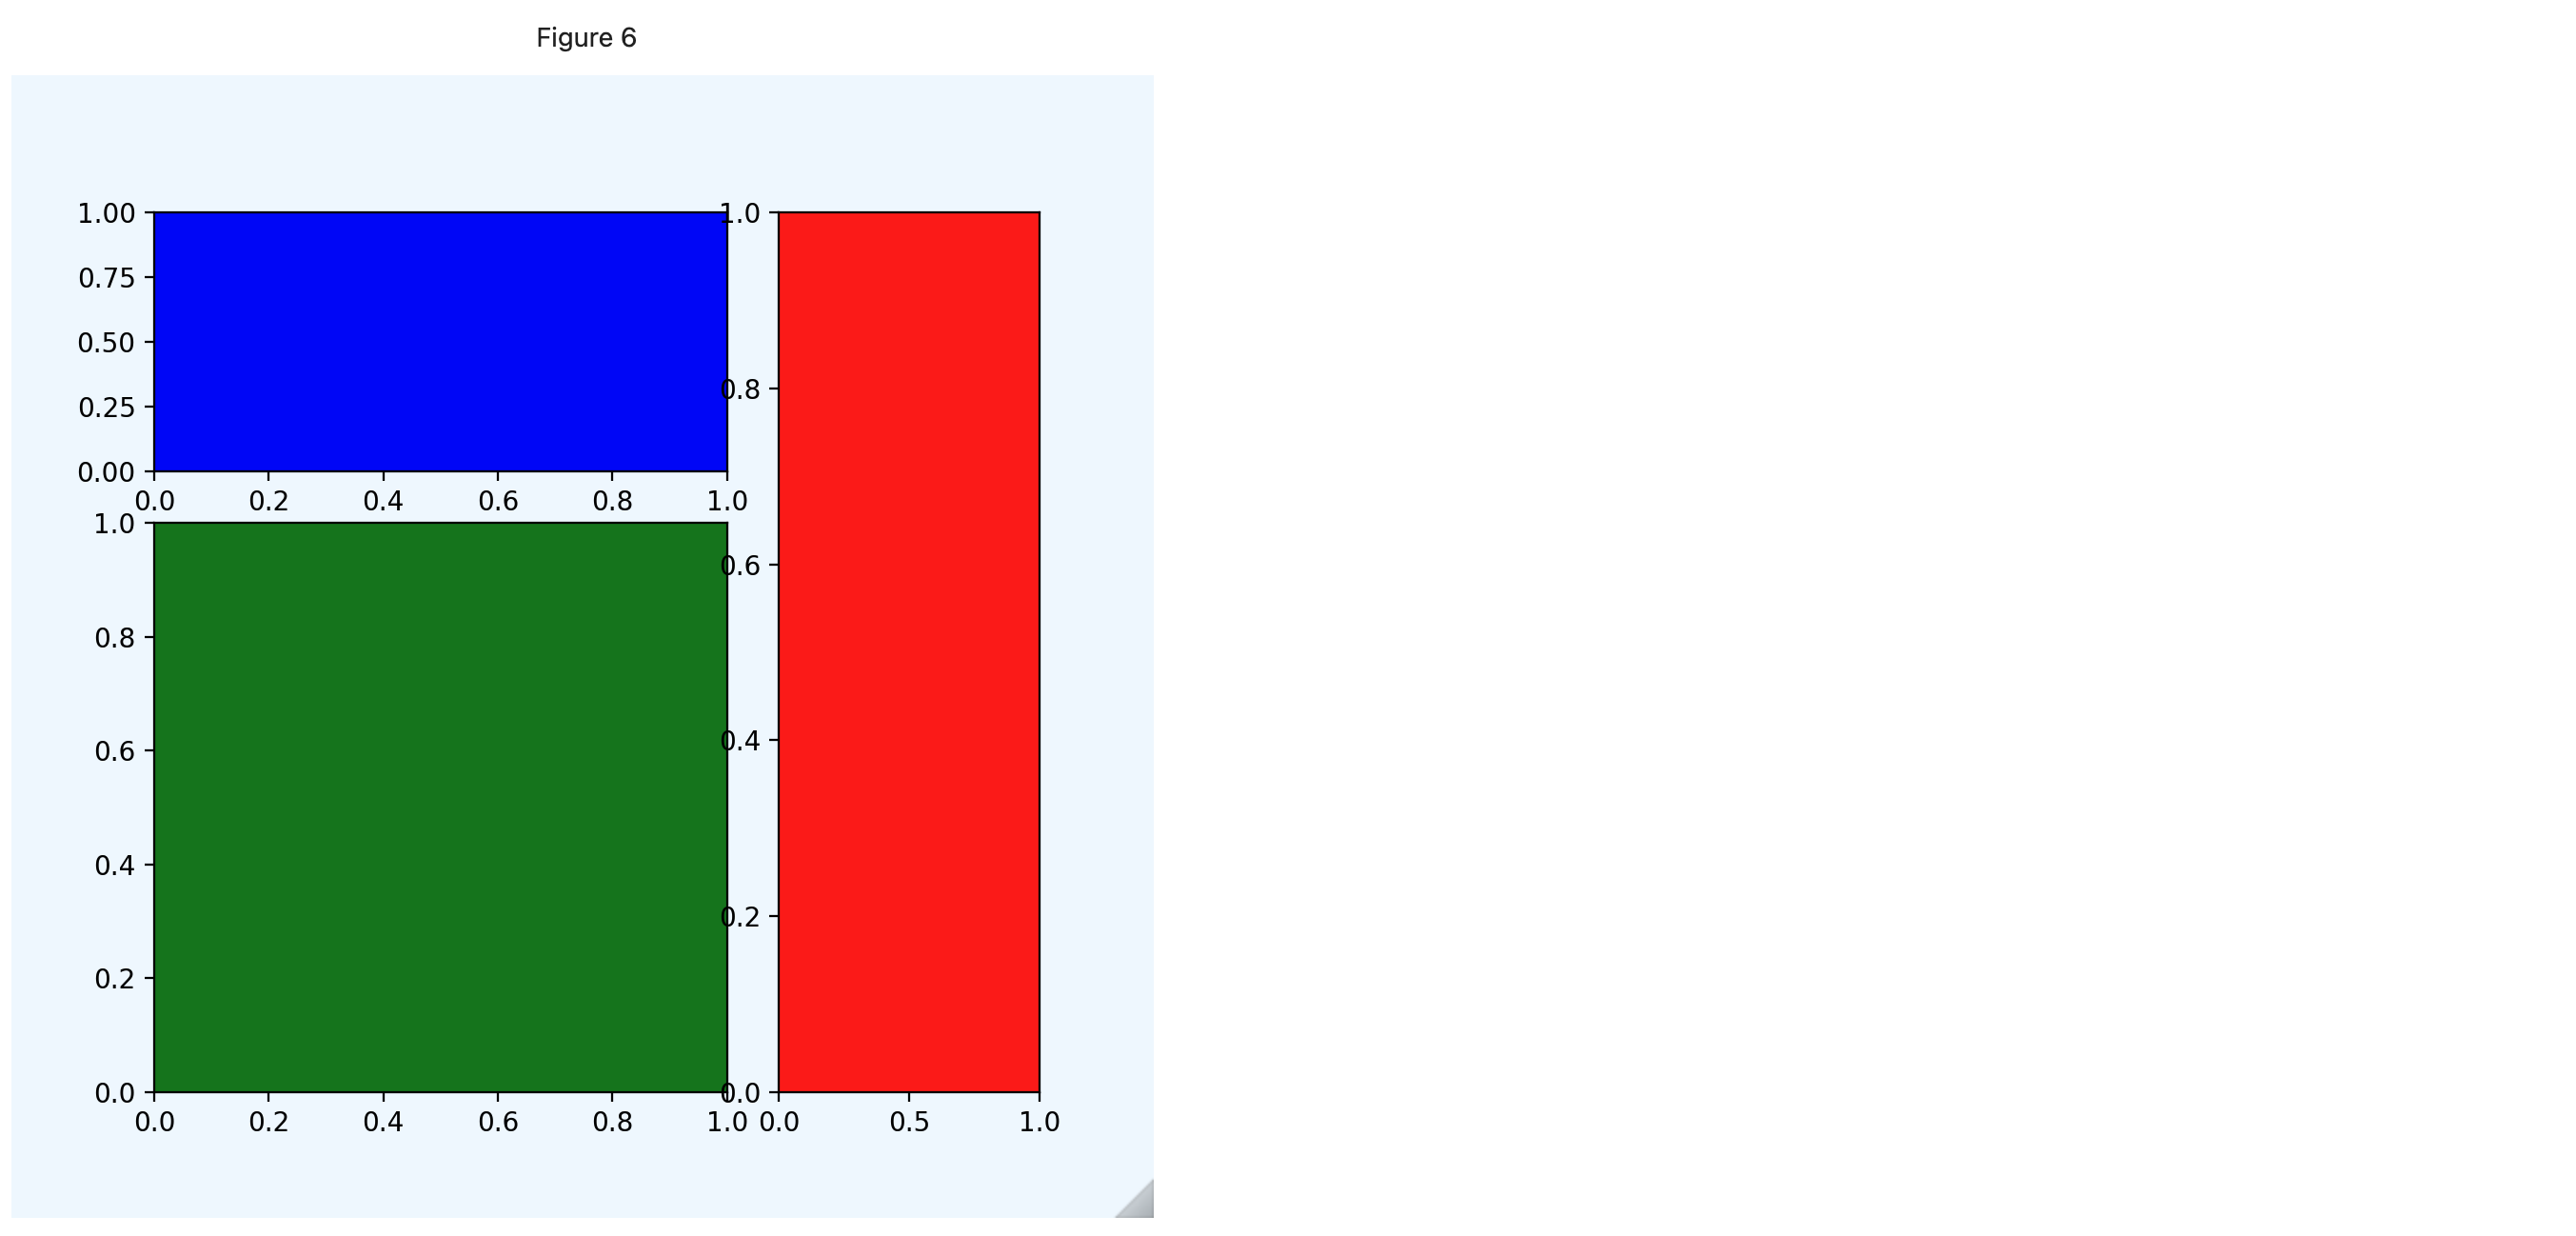
ax = plt.subplot2grid(fig=fig)- 코드는 짧아지지만 첫 번째 방법에 비해 헷갈린다
# shape=(3, 3): 3행 3열로 할 때의 9칸중 1칸에 해당하는 모습
# loc=(0, 0): 0행 0열에서 그림을 그린다
# colspan=2: 9칸중 1칸에 해당하는 그림의 컬럼 너비를 2칸 차지하도록 한다
ax1 = plt.subplot2grid(shape=(3, 3), loc=(0, 0), colspan=2, fig=fig, facecolor='blue')

ax2 = plt.subplot2grid(shape=(3, 3), loc=(1, 0), rowspan=2, colspan=2, fig=fig, facecolor='green')

ax3 = plt.subplot2grid(shape=(3, 3), loc=(0, 2), rowspan=3, colspan=1, fig=fig, facecolor='red')