


Table of Contents
Axes Customizing
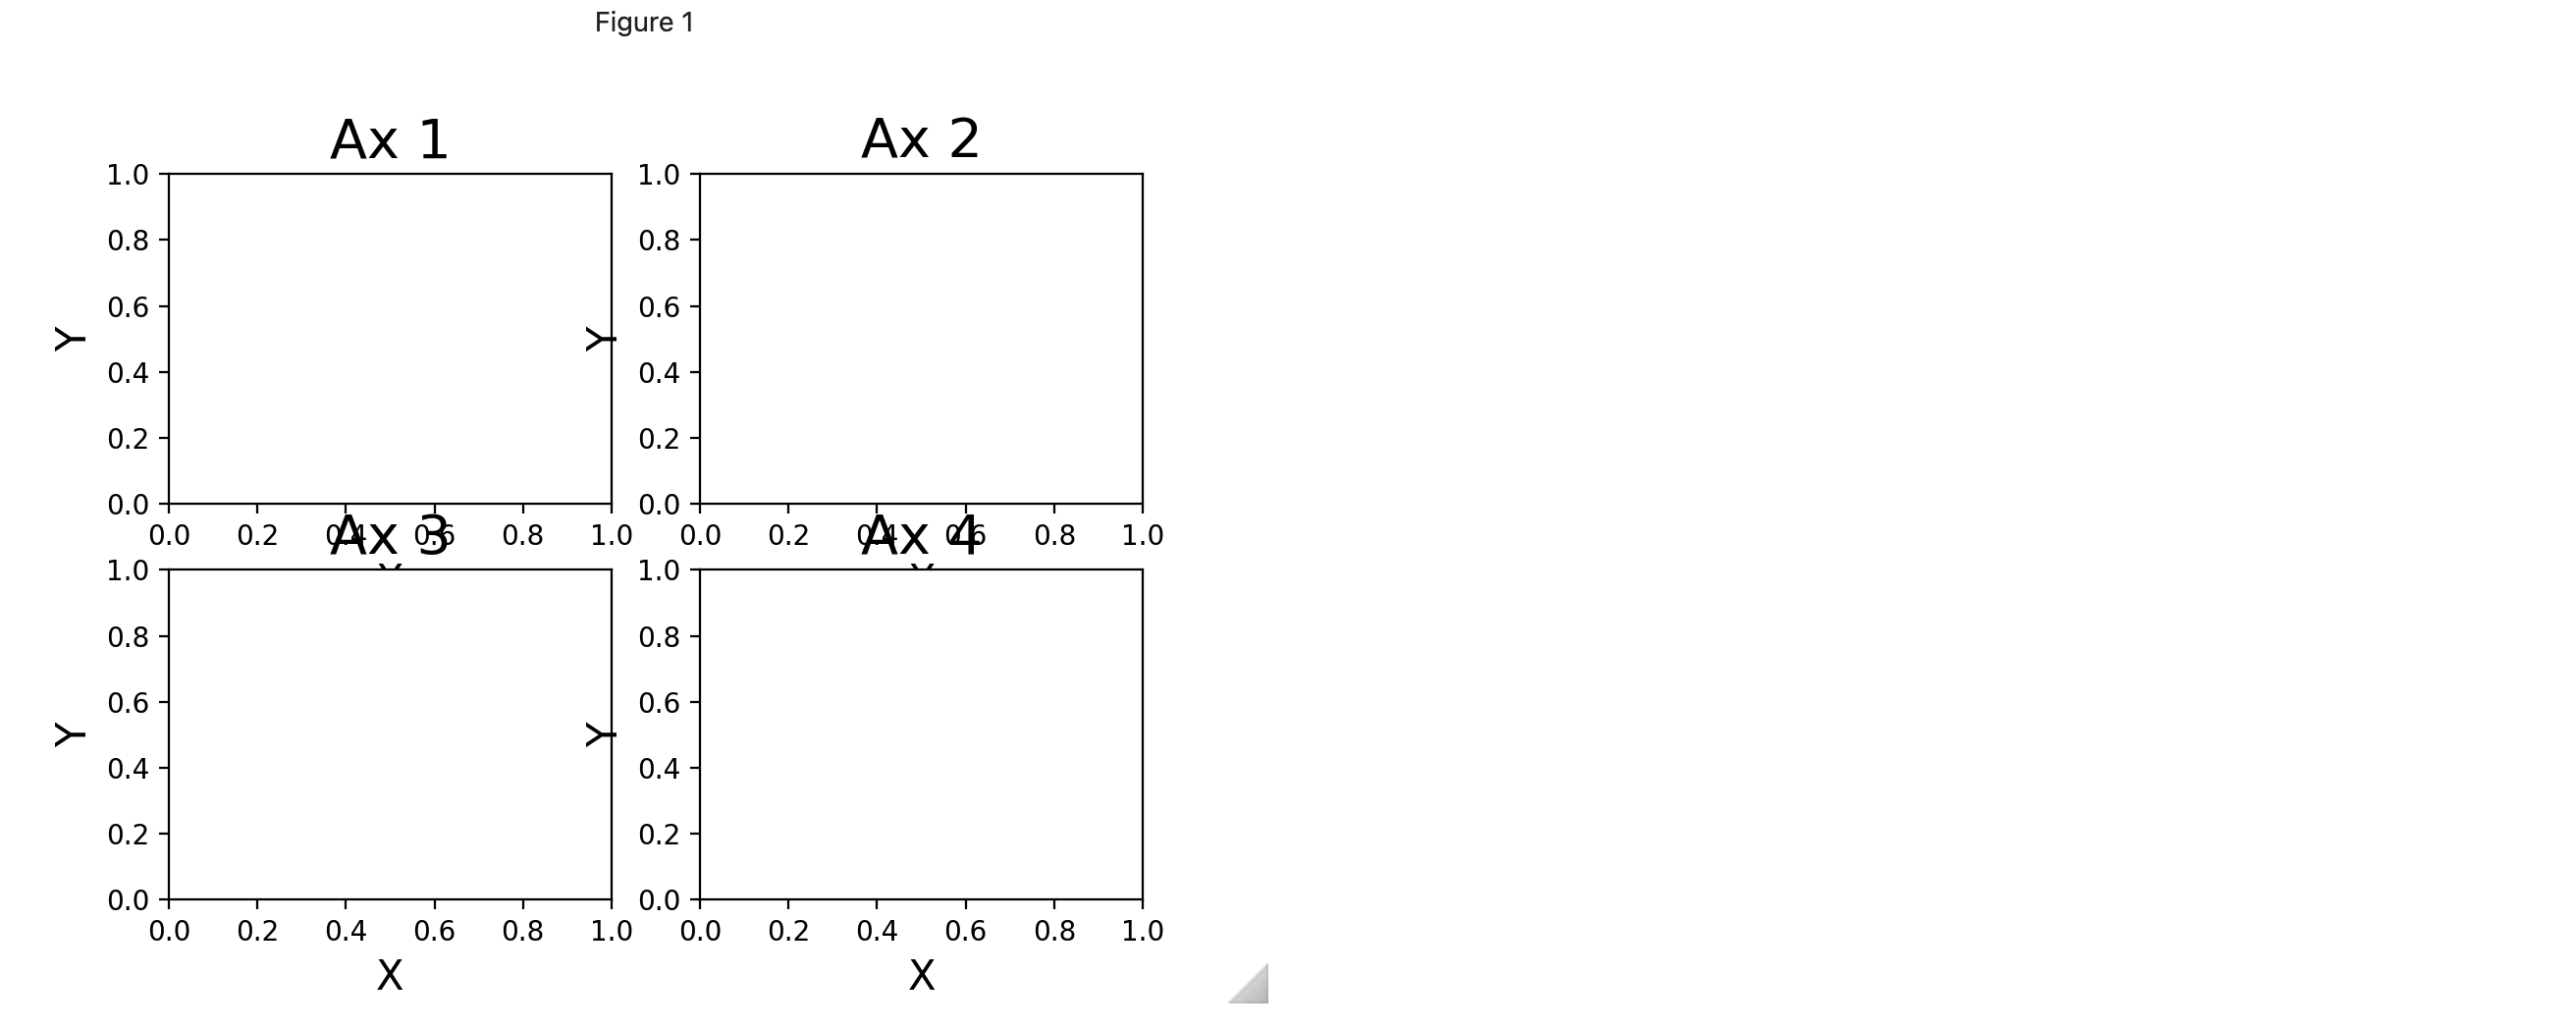
import matplotlib.pyplot as plt

fig, axes = plt.subplots(nrows=2, ncols=2)

axes = axes.flatten()

for i in range(len(axes)):
    axes[i].set_title(f'Ax {i+1}', fontsize=20)
    axes[i].set_xlabel('X', fontsize=15)
    axes[i].set_ylabel('Y', fontsize=15)
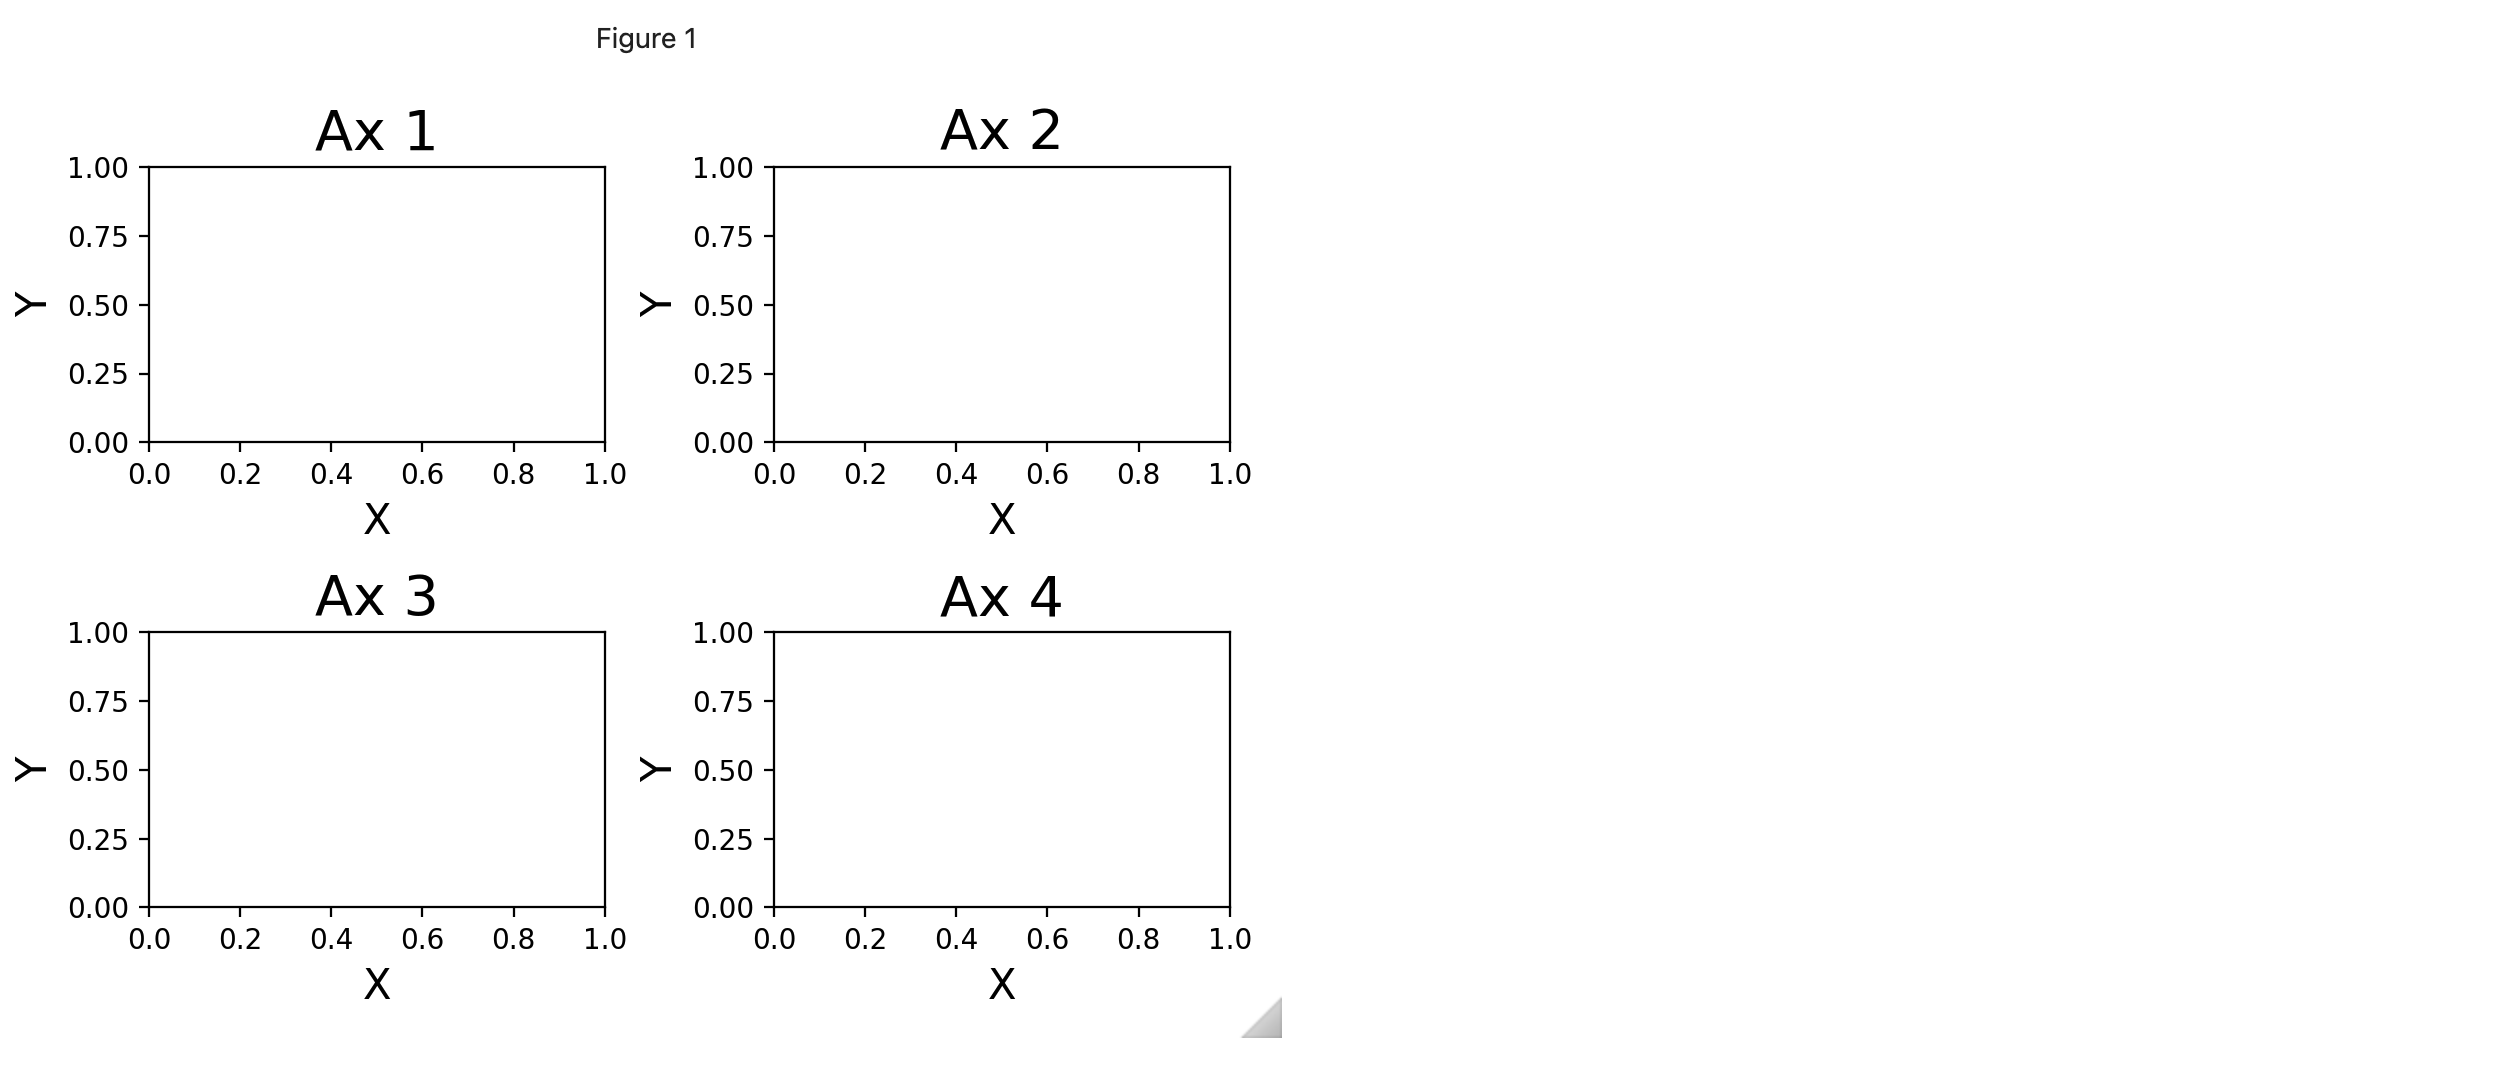
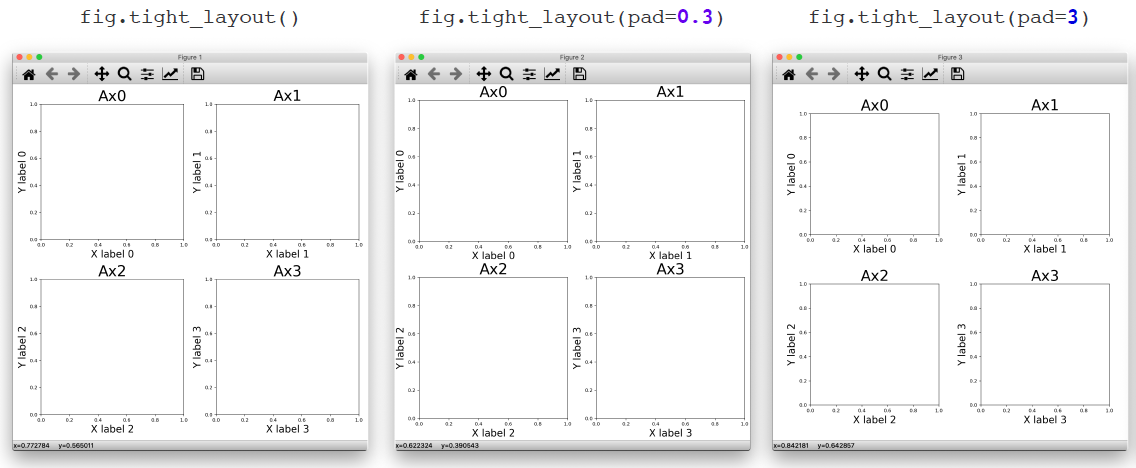
그림과 그림간의 간격 조절하기
fig.tight_layout()
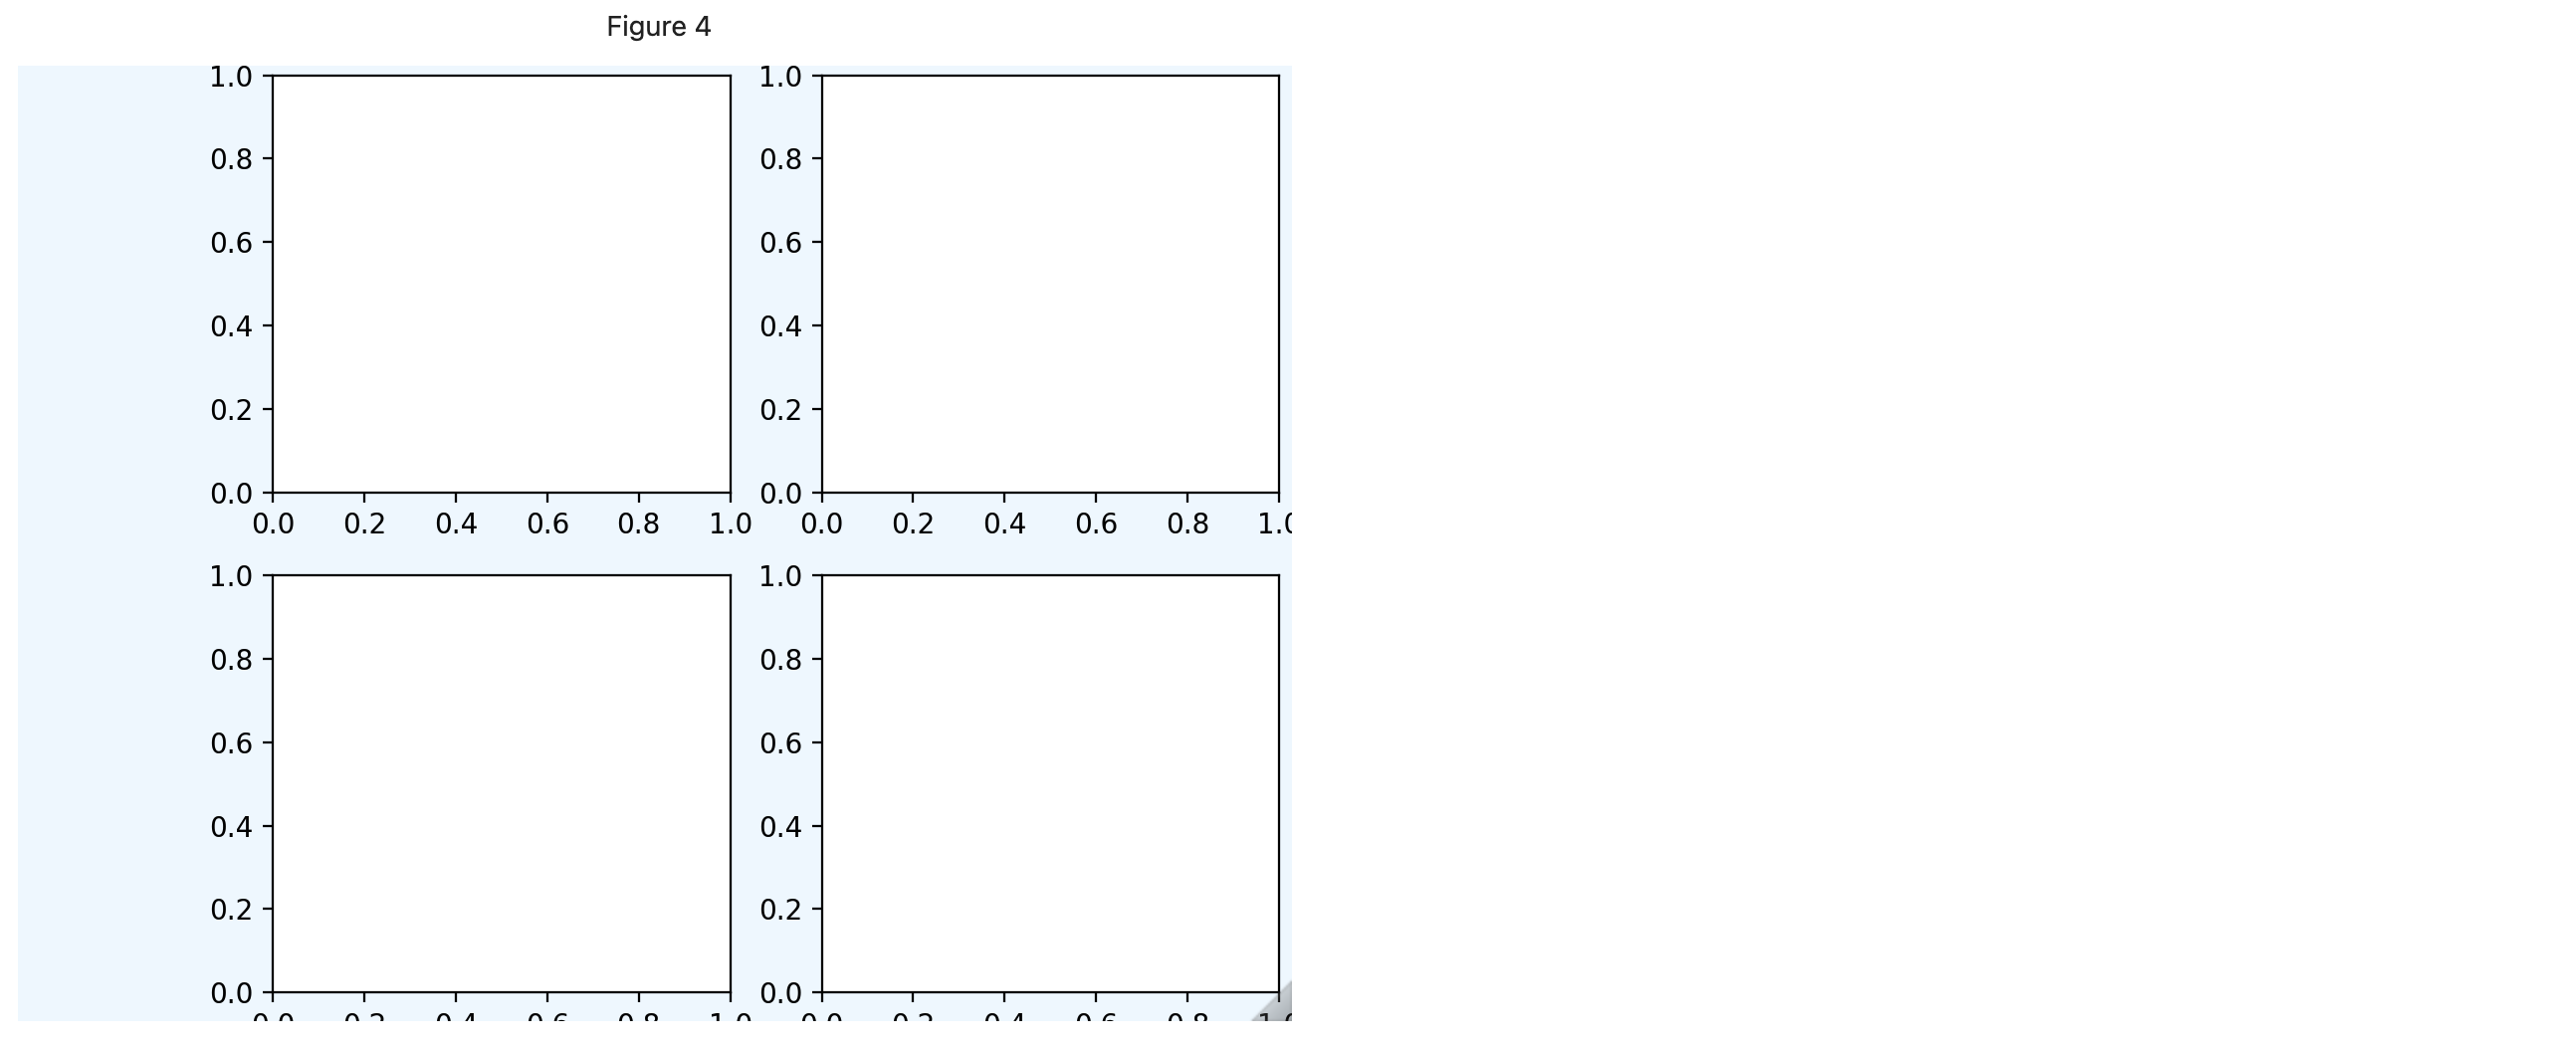
도화지와 그림간의 여백 조절하기
# left=0.2: 왼쪽에서 20% 되는 부분에서 시작한다
# bottom=0.03: 아래쪽에서 3% 되는 부분에서 시작한다
# right=0.99: 오른쪽으로 99% 까지 간다
# top=0.99: 위쪽으로 99% 까지 간다
fig.subplots_adjust(left=0.2, bottom=0.03, right=0.99, top=0.99)
Ax Customizing
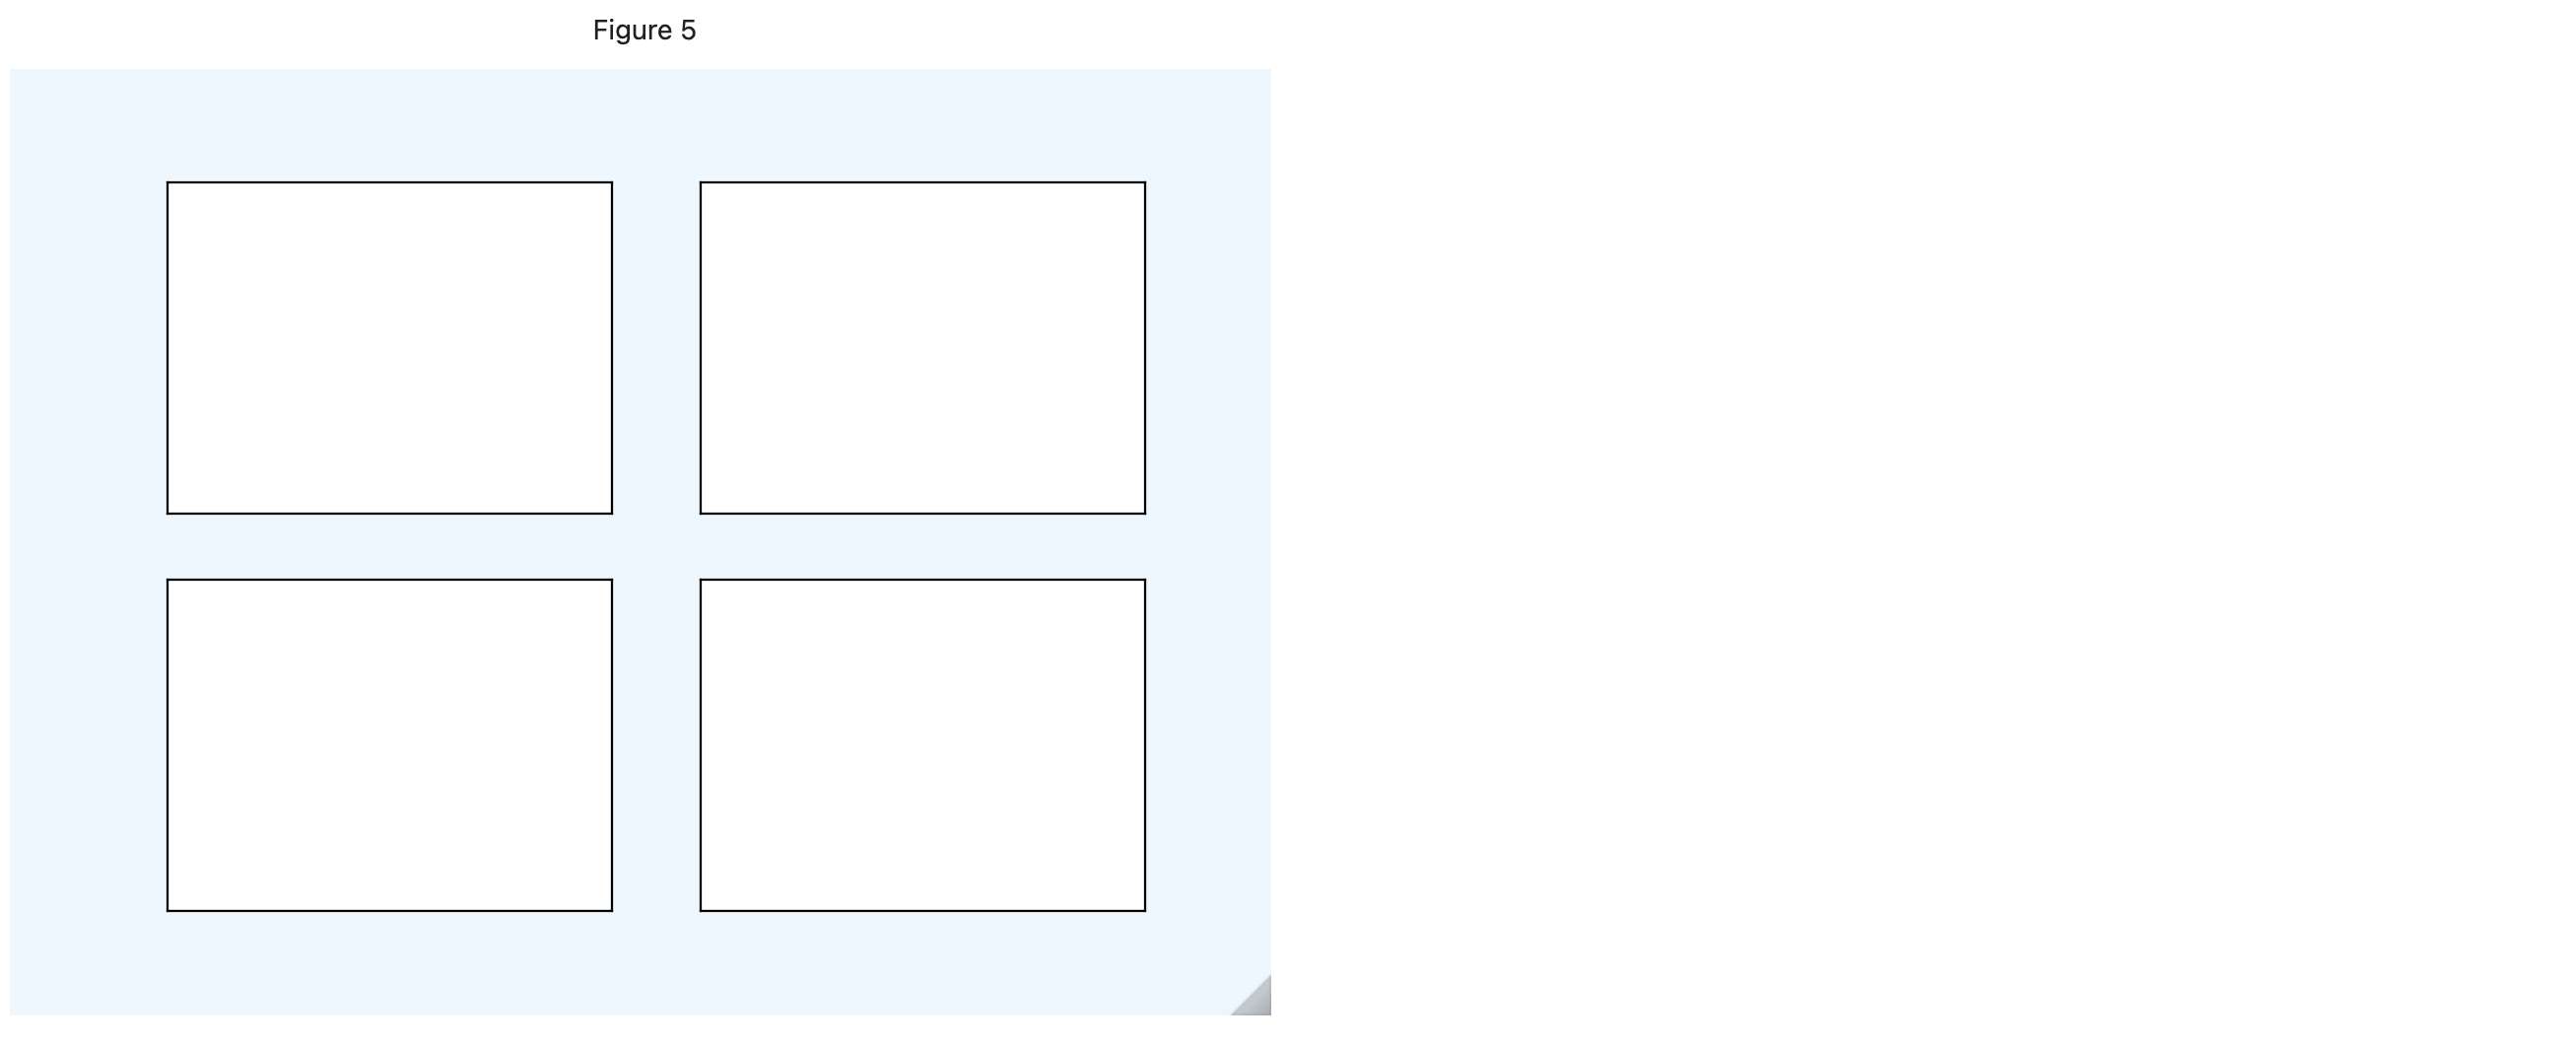
눈금 없애기
for i in range(len(axes)):
    axes[i].get_xaxis().set_visible(False)
    axes[i].get_yaxis().set_visible(False)
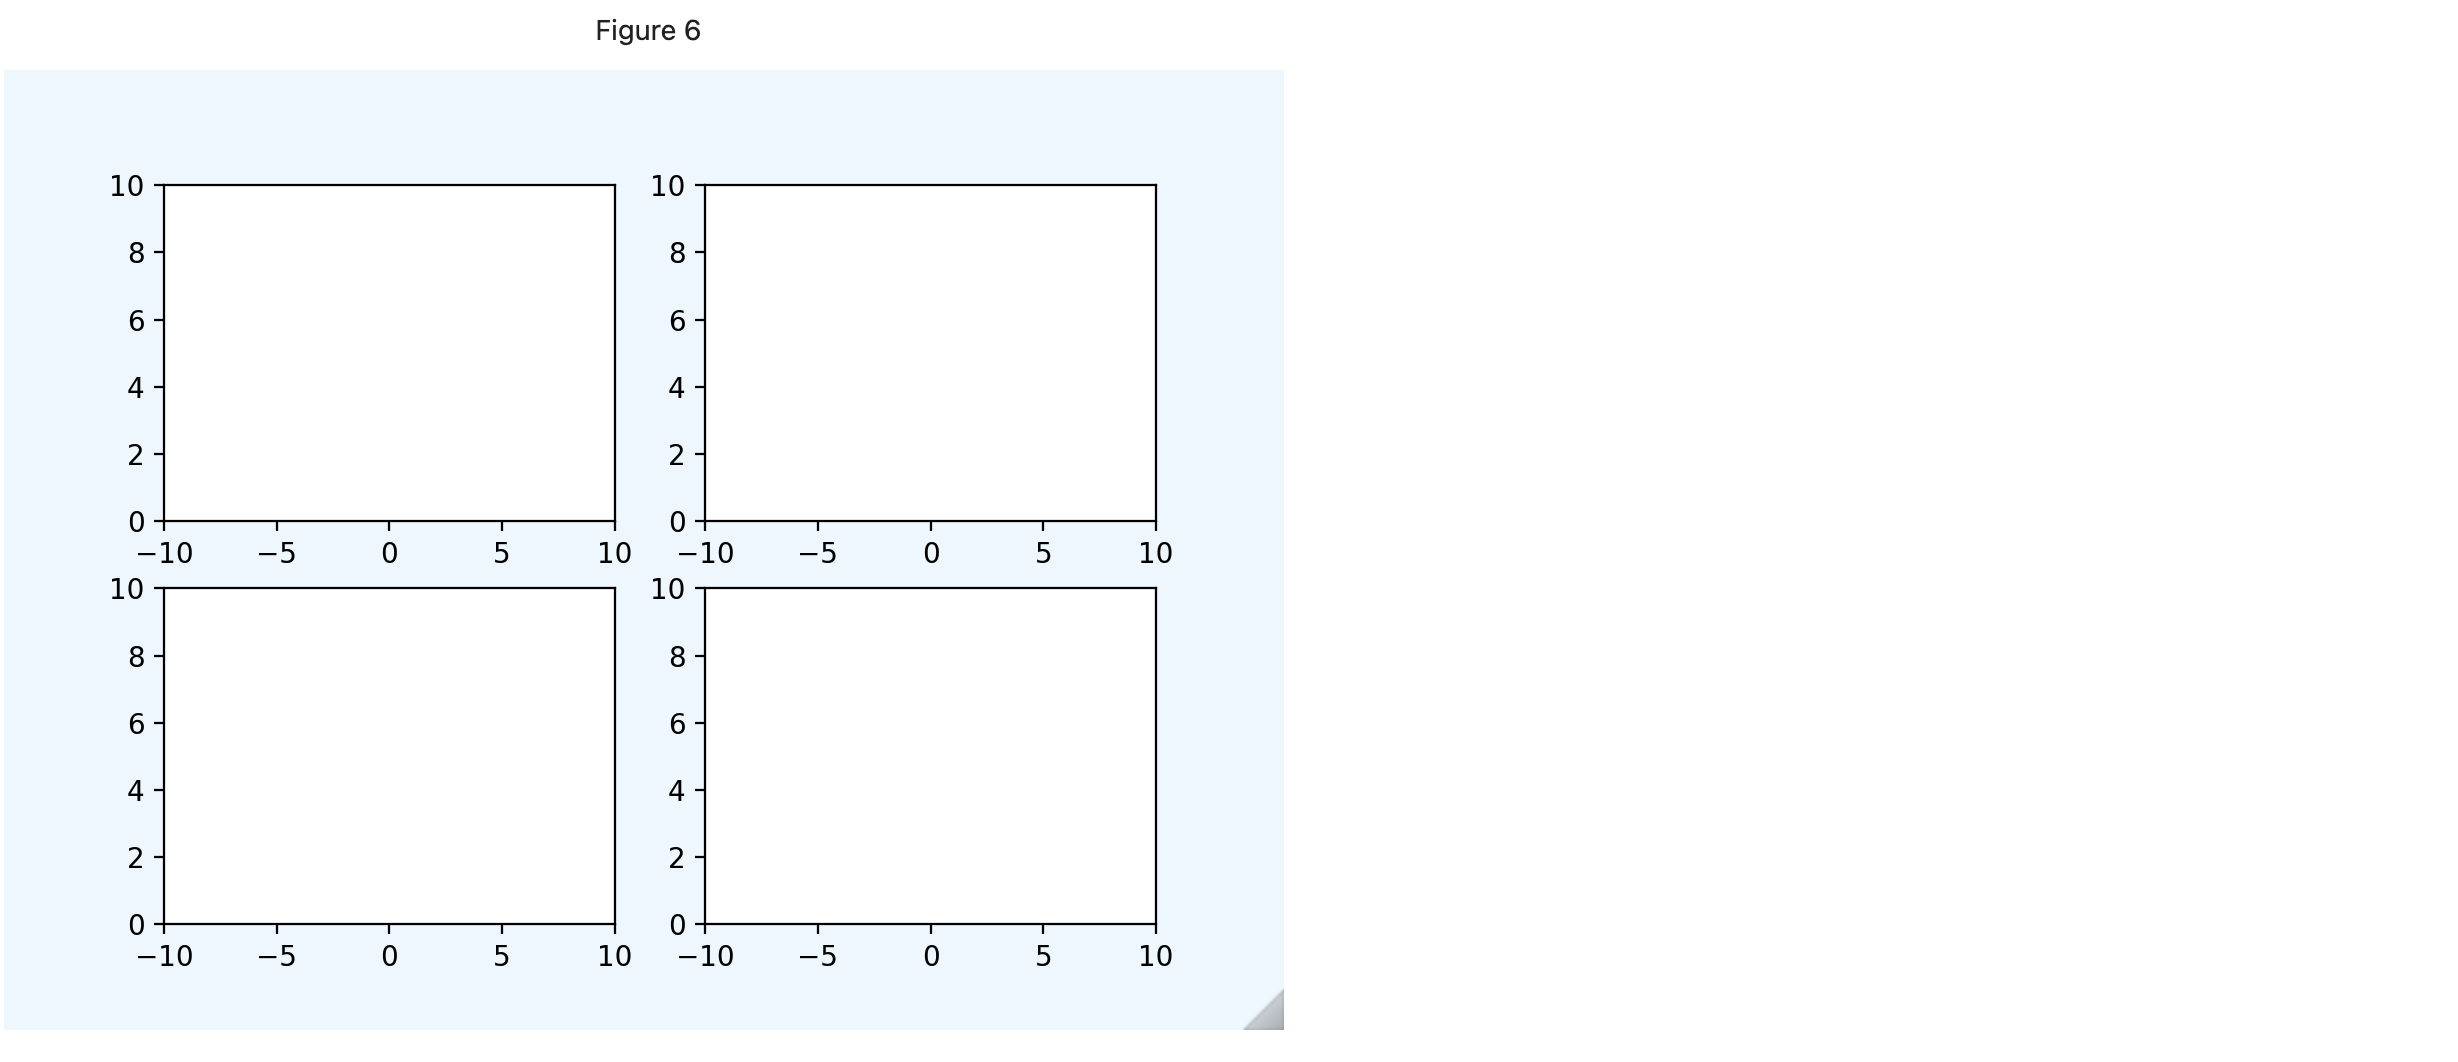
눈금 범위 정하기
for i in range(len(axes)):
    axes[i].set_xlim([-10, 10])
    axes[i].set_ylim([0, 10])
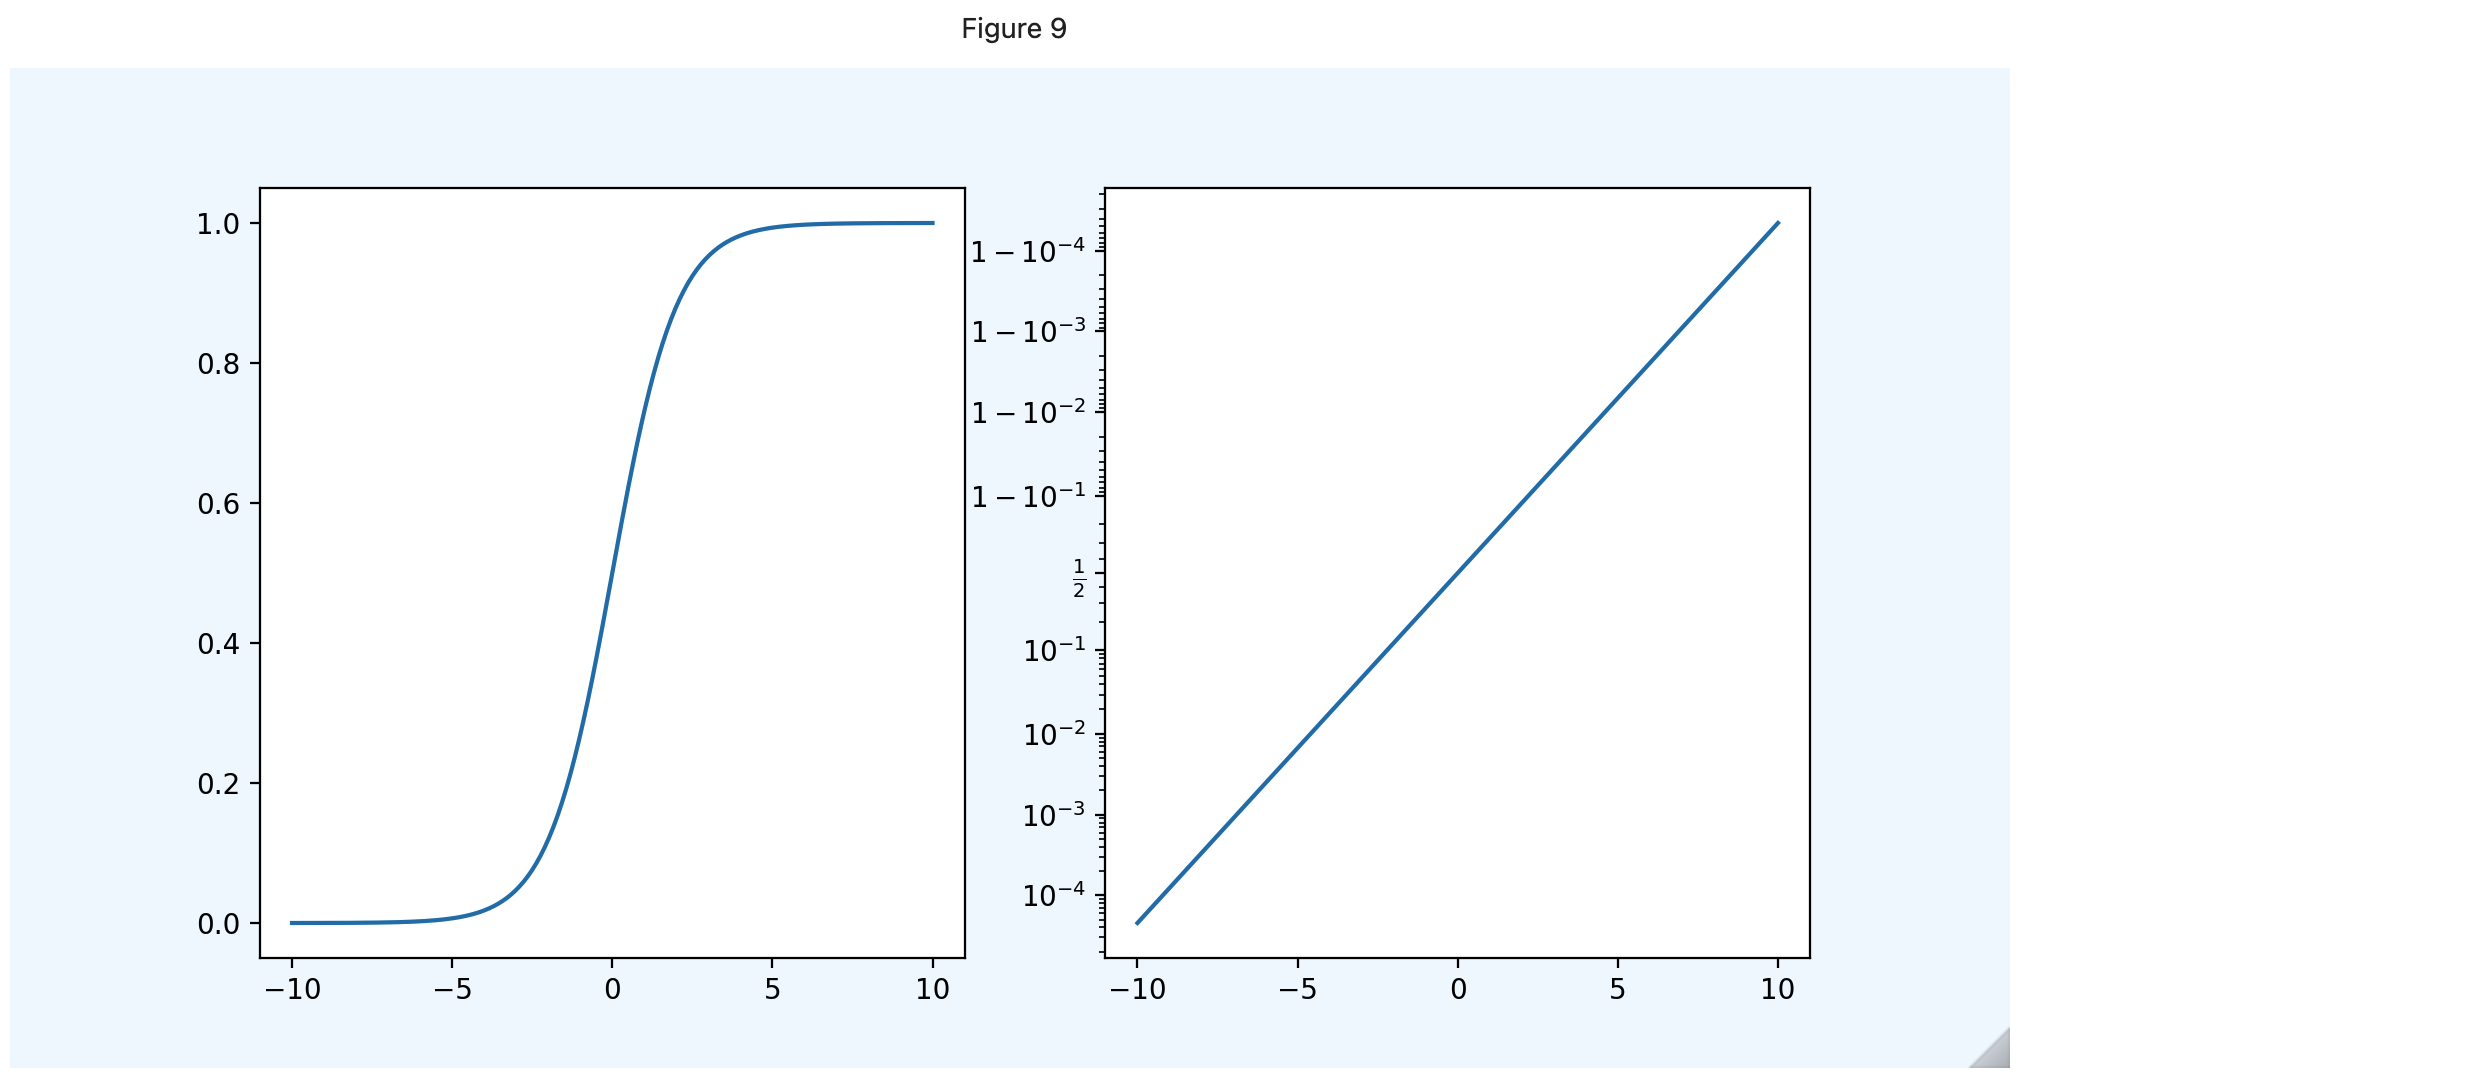
눈금 스케일 정하기
logit = np.linspace(-10, 10, 300) # -10과 10 사이를 300개로 나눔
sigmoid = 1 / (1 + np.exp(-logit))

axes[0].plot(logit, sigmoid)

axes[1].set_yscale('logit')
axes[1].plot(logit, sigmoid)
축 공유하기
# 일괄적으로 Axis share하려는 경우
fig, axes = plt.subplots(2, 2, figsize=(7, 7), sharex=True, sharey=True)
# 좀 더 자유로운 방법으로 Axis share하고 싶을 때
fig = plt.figure(figsize=(7, 7))
ax1 = fig.add_subplot(211)
ax2 = fig.add_subplot(212, sharex=ax1)